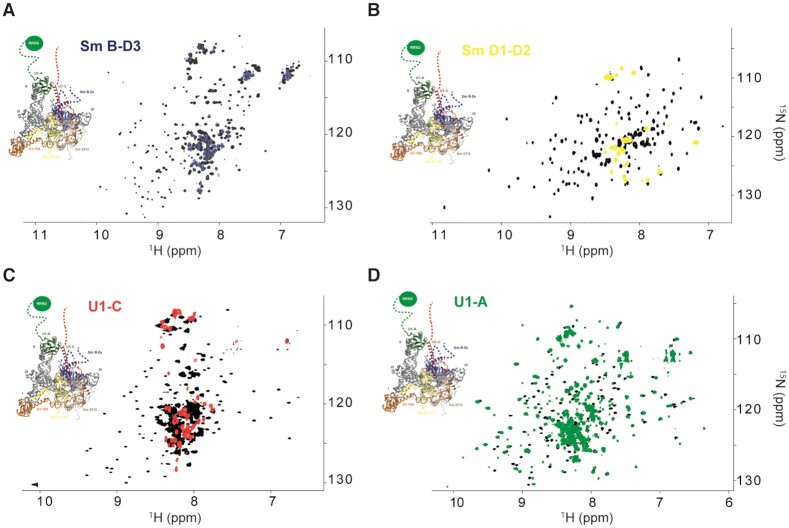
Figure 3.
NMR fingerprints of the U1 snRNP tails. (A) Overlay of the 2D 1H-15N TROSY HSQC spectra of Sm B-D3 (black) and Sm B-D3 embedded in U1 snRNP (blue). (B) Overlay of the 2D 1H-15N TROSY HSQC spectra of Sm D1-D2 (black) and Sm D1-D2 embedded in U1 snRNP (yellow). (C) Overlay of the 2D 1H-15N TROSY HSQC spectra of U1-C in complex with unlabeled Sm B-D3 (black) and U1-C embedded in U1 snRNP (red). (D) Overlay of the 2D 1H-15N TROSY HSQC spectra of U1-A (black) and U1-A embedded in U1 snRNP (green). On each spectrum, a representation of the 3D structure of U1 snRNP is shown (17).

