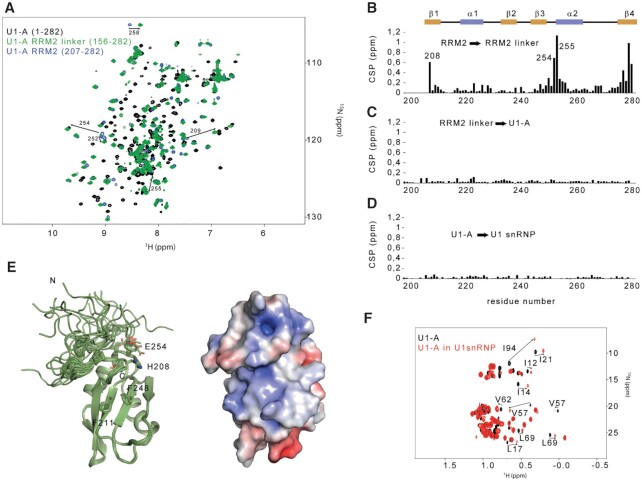
Figure 4.
The U1-A RRM2 domain forms an independent structural module in the context of the particle. (A) Overlay of the 2D 1H-15N HSQC spectra of U1-A (1–282, black), U1-A RRM2 linker (156–282, green) and U1-A RRM2 (204–282, blue). (B) Plot of the chemical shift perturbations (CSP) in function of the sequence observed between U1-A RRM2 and U1-A RRM2 linker. The CSP cluster at the boundaries of the protein and at the N-terminal tip of helix α2. (C) Plot of the CSP as a function of the sequence observed between U1-A RRM2 linker and full-length U1-A. Almost no changes were observed. (D) Plot of the CSP as a function of the sequence observed between U1-A and U1-A embedded in U1 snRNP. Almost no changes were observed. (E) Ribbon representation of the solution structure of U1-A RRM2 linker (190–282). On the right, the electrostatic surface potential of the lowest energy model is shown. (F) Overlay of the 2D 1H-13C HMQC centred on the methyl group signals of U1-A (black) and U1-A embedded in U1 snRNP (red). All the resonances that shifted are from the RRM1 domain.

