Figure 5.
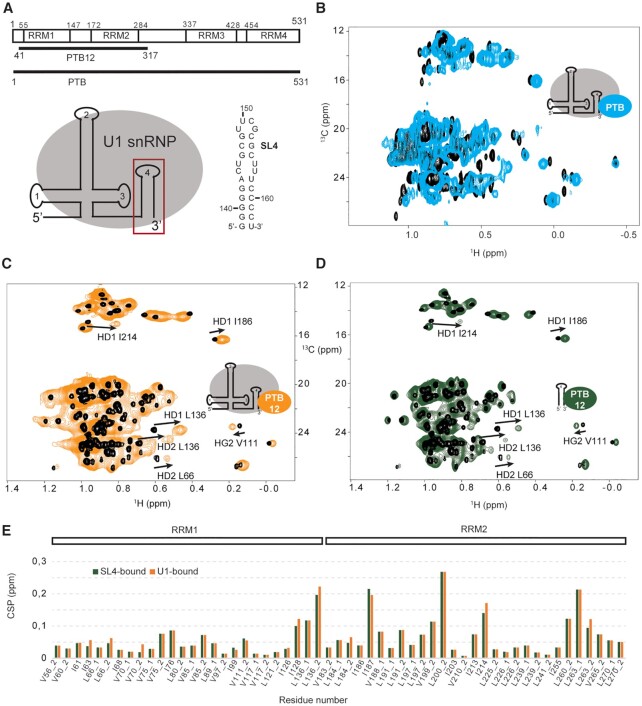
Interaction between U1 snRNP and the splicing factor PTBP1 monitored by NMR spectroscopy. (A) Schematic representation of the PTBP1 constructs and of the RNA stem loop sequence. (B) Overlay of the 2D 1H-13C HMQC spectra of the free PTBP1 protein (black) and in complex with U1 snRNP (cyan). (C) Overlay of the 2D 1H-13C HMQC spectra of the free PTBP1 N-terminal half (PTB12, black) and in complex with U1 snRNP (orange). (D) Overlay of the 2D 1H-13C HMQC spectra of the free PTBP1 N-terminal half (PTB12, black) and in complex with U1 stem loop 4 (green). (E) Plot showing the chemical shift perturbations (CSP) of the methyl groups of ILV of PTBP1 N-terminal observed upon addition of U1 snRNP (orange) or U1 snRNA SL4 (green). Methyl groups are labeled according to the residue number and _1 or _2 stands for HD1/CD1 and HD2/CD2 in the case of leucine or HG1/CG1 and HG2/CG2 in the case of valine.

