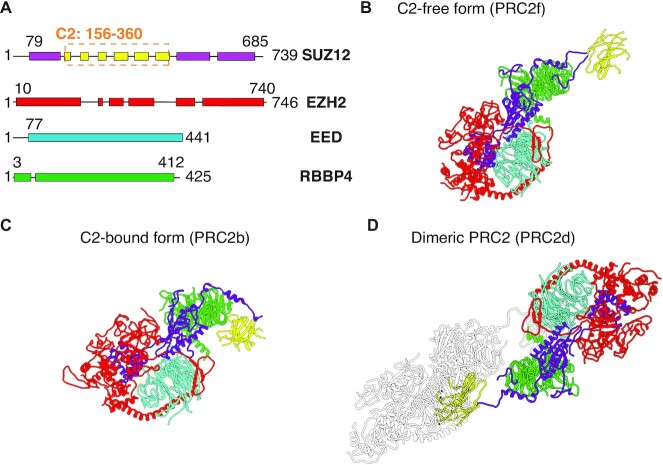
Figure 1.
Illustration of the three conformations constructed for the PRC2 core complex via homology modeling. (A) Schematic diagram highlighting the ordered (box) and disordered (line) domains in each subunit. (B–D) corresponds to the conformation that adopts a free C2 domain (B), a bound C2 domain (C) and a dimeric structure (D), respectively. The coloring scheme is the same as in part A. Disordered regions are not shown for visual clarity.

