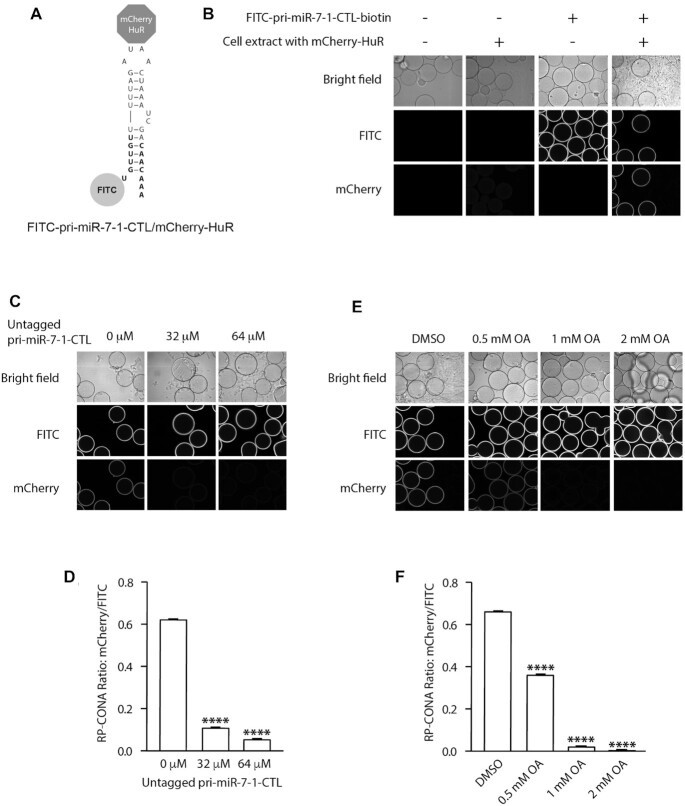
Figure 3.
Optimization of RP-CONA method in the Opera HCS. (A) A diagram illustrating the interaction between FITC-pri-miR-7–1-CTL and mCherry-HuR. (B) Beads images of blank beads; blank beads incubated with cell lysates containing mCherry-HuR; FITC-pri-miR-7–1-CTL-beads incubated in lysates-free buffer; and FITC-pri-miR-7–1-CTL-beads after mCherry-HuR pulldown. (C andD) mCherry/FITC signals were reduced by untagged pri-miR-7–1-CTL. Cell lysates containing mCherry-HuR were treated with an increased concentration of untagged pri-miR-7–1-CTL before pull-down. (E and F) mCherry/FITC signals were reduced by a pri-miR-7–1/HuR inhibitor. Cell lysates containing mCherry-HuR were treated with DMSO or an increased concentration of OA before pull-down. All values were obtained from three technical repeats. Mean mCherry/FITC ring intensities and SD between triplicates are shown. Statistically significant differences compared to 0 μM untagged pri-miR-7–1 or DMSO were interpreted by SPSS independent sample t-test, ****P< 0.0001.

