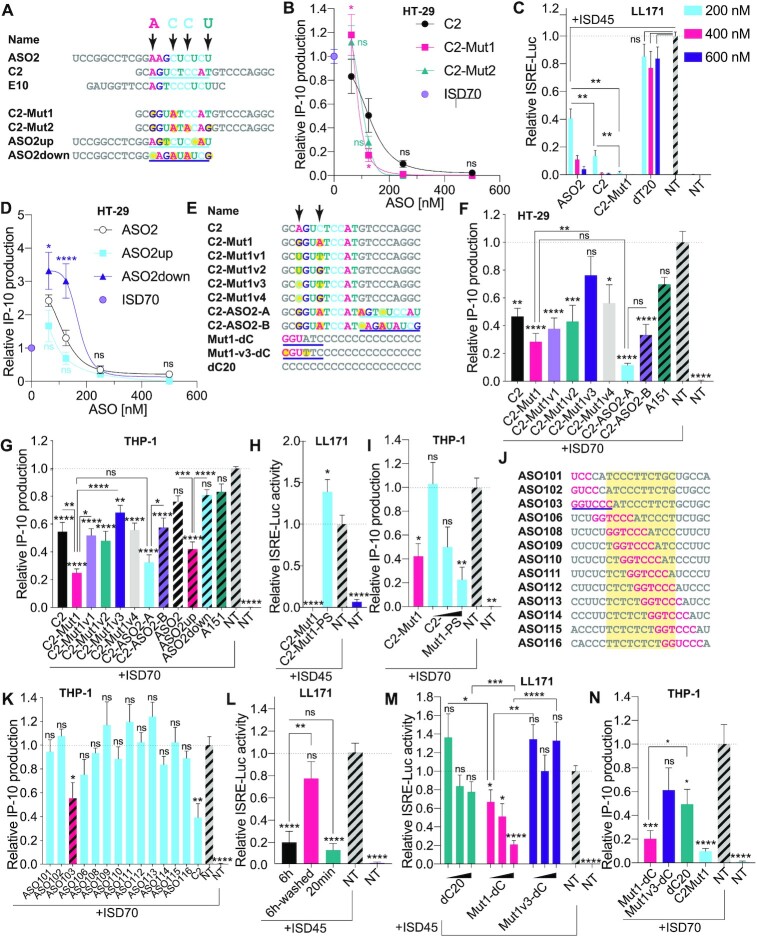
Figure 2.
Identification of a highly potent inhibitor of cGAS sensing. (A) Top: sequence alignments of cGAS inhibitors and identification of important bases predicted by MEME analysis, highlighted with arrows (Supplementary Figure S1A). Bottom: design of C2 and ASO2 mutants incorporating point mutations at selected positions of the MEME motif (mutations are highlighted in yellow). (B, D) HT-29 cells pre-treated overnight with indicated doses of ASOs (500, 250, 125, 62.5 nM), were transfected or not with 2.5 μg/ml of ISD70 for 24 h and IP-10 levels in supernatants were determined by ELISA. IP-10 levels were normalised to the ‘ISD70 only’ condition, after background correction to the NT condition. Data shown are averaged from two (D) or three (B) independent experiments in biological triplicate (± s.e.m and ordinary two-way ANOVA with Tukey's multiple comparison tests relative to C2 [B] or ASO2 [D] conditions, are shown; comparisons were not significant between the ASOs for 250 and 500 nM). (C) Mouse LL171 cells were treated for 6 h with indicated amount of ASOs (200, 400, 600 nM) prior to overnight stimulation with 2.5 μg/ml ISD45. Cells were lysed and ISRE-Luc levels were analysed by luciferase assay the next day. ISRE-luciferase levels were normalised to the ‘ISD45 only’ condition, after background correction with NT condition. Data shown are averaged from two independent experiments in biological triplicate (± s.e.m and Mann-Whitney U tests are shown). (E) Top: sequence alignments of C2-Mut1 variants; C2-ASO2-A and C2-ASO2-B have the 3′ ends from ASO2up and ASO2down underlined. Bottom: variants of the homopolymer dC20; 2′OMe bases are in pink and the cGAS inhibitory motif underlined. (F) HT-29 cells pre-treated overnight with 187.5 nM indicated ASOs were transfected or not with 2.5 μg/ml of ISD70 for 24 h and IP-10 levels in supernatants were determined by ELISA. (G) THP-1 pre-treated overnight with 100 nM indicated ASOs were transfected with 2.5 μg/ml of ISD70 for 24 h and IP-10 levels in supernatants determined by ELISA. (F, G) IP-10 levels were normalised to the ‘ISD70 only’ condition, after background correction with the NT condition. Data shown are averaged from three independent experiments in biological triplicate (± s.e.m. and ordinary one-way ANOVA with Tukey's multiple comparison tests relative to condition ‘ISD70 only’, or otherwise indicated pairs of conditions are shown). (H) LL171 cells were treated for 6 h with 200 nM ASOs prior to overnight stimulation with 2.5 μg/ml ISD45. Cells were lysed and ISRE-Luc levels were analysed by luciferase assay the next day. ISRE-luciferase levels were normalised to the ‘ISD45 only’ condition, after background correction with the NT condition. Data shown are averaged from three independent experiments in biological triplicate (± s.e.m. and ordinary one-way ANOVA with Dunnett's multiple comparison tests to the ‘ISD70 only’ condition are shown). (I) THP-1 cells treated for 6 h with 100 nM C2-Mut1, or 100, 250, 500 nM of C2-Mut1-PS were transfected with 2.5 μg/ml of ISD70 overnight. IP-10 levels were normalised to the ‘ISD70 only’ condition, after background correction with the NT condition. Data shown are averaged from two independent experiments in biological triplicate (± s.e.m and Mann-Whitney U tests to the ‘ISD70 only’ condition are shown). (J) Sequences of [LINC-PINT] ASOs 101–116, showing the location of the inhibitory GGUCCC motif (in pink) from ASO103 identified by MEME (see E and Supplementary Figure S1B). The yellow region highlights the DNA moiety of the gapmers. (K) THP-1 pre-treated overnight with 100 nM indicated [LINC-PINT] ASOs, were transfected with 2.5 μg/ml of ISD70 for 7.5 h and IP-10 levels in supernatants were determined by ELISA. IP-10 levels were normalised to the ‘ISD70 only’ condition, after background correction with the NT condition. Data shown are averaged from three independent experiments in biological triplicate (± s.e.m and one-way ANOVA with Dunnett's multiple comparison tests to the ‘ISD70 only’ condition are shown). (L, M) LL171 cells were treated for 6 h or 20 min with 200 nM ASOs prior to being ‘washed’ or not (L), or treated with 50, 100 or 200 nM ASOs for 20 min (M), and stimulated overnight with 2.5 μg/ml ISD45. Cells were lysed and ISRE-Luc levels were analysed by luciferase assay the next day. ISRE-luciferase levels were normalised to the ‘ISD45 only’ condition, after background correction with the NT condition. Data shown are averaged from two (L) or three (M) independent experiments in biological triplicate (± s.e.m. and one-way ANOVA with Tukey's multiple comparison tests to the ‘ISD45 only’ condition (L), or Mann-Whitney U tests to the ‘ISD45 only’ condition (M), or otherwise indicated pairs of conditions, are shown). (N) THP-1 pre-treated for 40 min with 250 nM indicated ASOs, were transfected overnight with 2.5 μg/ml of ISD70 and IP-10 levels in supernatants were determined by ELISA. Data shown are averaged from three independent experiments in biological triplicate (±s.e.m. and ordinary one-way ANOVA with Dunnett's multiple comparison tests to the ‘ISD70 only’ condition, and a Mann-Whitney U test comparing Mut1-dC and dC20 are shown). *P ≤ 0.05, **P ≤ 0.01, ***P ≤ 0.001, ****P ≤ 0.0001, ns: non-significant.

