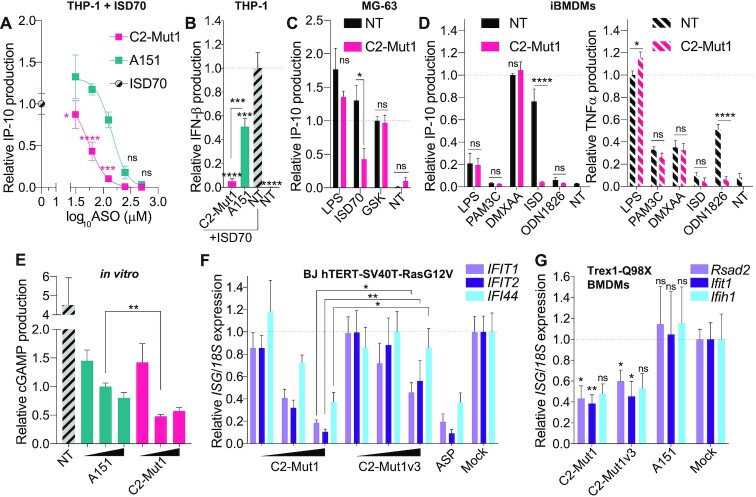
Figure 3.
Sequence-dependent inhibition of cGAS function. (A, B) THP-1 pre-treated 6 h with indicated doses (500, 250, 125, 62.5, 31.25 nM) (A) or 125 nM (B) of C2-Mut1 or A151 oligonucleotides, were transfected with 2.5 μg/ml of ISD70 overnight, and IP-10 (A) or IFN-β (B) levels in supernatants were determined by ELISA. IP-10 (A) and IFN-β (B) levels were normalised to the ‘ISD70 only’ condition, after background correction with the NT condition. (A, B) Data shown are averaged from three independent experiments in biological triplicate (± s.e.m. and ordinary two-way ANOVA with Sidak's multiple comparison tests relative to A151 are shown [A] or ordinary one-way ANOVA with Tukey's multiple comparison tests relative to condition ‘NT’, or otherwise indicated pairs of conditions are shown [B]). MG-63 (C) or mouse immortalised BMDMs (D) were pre-treated or not with 500 nM of C2-Mut1 for 6 h prior to stimulation with 2.5 μg/ml ISD (ISD70 for MG-63, ISD45 for BMDMs), LPS (1 μg/ml), GSK (100 nM), PAM3C (100 ng/ml), ODN1826 (500 nM), or DMXAA (50 μg/ml) overnight. IP-10 (C and D) and TNF-α (D) levels in supernatants were determined by ELISA. (C) Data were normalised to the ‘GSK’ condition, after background correction to the NT condition. Data shown are averaged from two independent experiments in biological triplicate (± s.e.m and Mann-Whitney U tests are shown). (D) IP-10 levels were normalised to the DMXAA condition, while TNF-α levels were normalised to the LPS condition. Data shown are averaged from three independent experiments in biological triplicate (± s.e.m and Mann-Whitney U tests are shown). (E) Recombinant cGAS protein was incubated in vitro with 2.3 μM ISD70 with or without (NT) increasing concentrations of ASOs (0.5, 2 and 10 μM) for 40 min. The reaction was stopped with EDTA and cGAMP levels were analysed by ELISA. Data were normalised to the condition A151 2 μM. Data shown are averaged from three independent experiments run in technical duplicate on the ELISA (± s.e.m and a Mann-Whitney U test is shown). (F) BJ hTERT SV40T cells were transfected overnight with an increasing amount of indicated ASO (20, 50, 100 nM), or 2 mM aspirin (ASP), prior to RNA purification. Expression of the panel of 3 human IFN-driven genes was analysed by RT-qPCR. Expression of the indicated genes was reported against to 18S expression and further normalised to the average of the ‘Mock’ condition. Data shown represent the average of three independent experiments conducted in biological duplicate (± s.e.m and Mann-Whitney U tests are shown). (G) Trex1-mutant primary BMDMs from three individual homozygous mice were transfected with 50 nM ASOs (or lipofectamine only, ‘Mock’) for 20 h, prior to RNA purification. Expression of the panel of three mouse IFN-driven genes was analysed by RT-qPCR. Expression of the indicated genes was reported against to 18s expression and further normalised to the average of the ‘Mock’ condition. Data shown represent the average of three mice conducted in biological duplicate (± s.e.m. and Mann–Whitney U tests are shown). *P ≤ 0.05, **P ≤ 0.01, ***P ≤ 0.001, ****P ≤ 0.0001, ns: non-significant.

