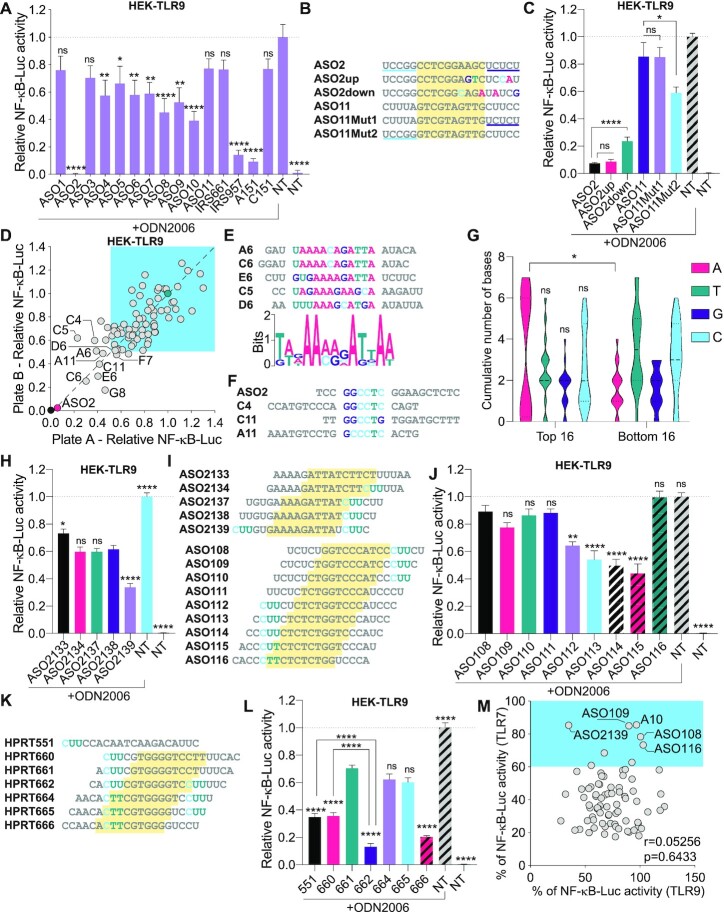
Figure 4.
Sequence-dependent TLR9 inhibition. (A, C) HEK-TLR9 cells expressing a NF-κB-luciferase reporter were treated with 500 nM indicated ASOs for 30 min prior to stimulation or not (non-treated [NT]) with 200 nM ODN2006. NF-κB-luciferase levels were measured after overnight incubation. NF-κB-luciferase levels were normalised to the ‘ODN2006 only’ condition, after background correction with the NT condition. Data shown are averaged from two (A) or three (C) independent experiments in biological triplicate (± s.e.m. and ordinary one-way ANOVA with Dunnett's multiple comparison tests to the ‘ODN2006 only’ condition [A] or Mann–Whitney U tests [C] are shown). (B) ASO2 and ASO11 sequence mutants. ASO11Mut1 and ASO11Mut2 contain the 3′ and 5′ end of ASO2, respectively. (D) HEK-TLR9 cells expressing a NF-κB-luciferase reporter were treated with 500 nM indicated ASOs for 45 min prior to stimulation or not with 200 nM ODN2006. NF-κB-luciferase levels were measured after overnight incubation. NF-κB-luciferase levels were normalised to the ‘ODN2006 only’ condition, after background correction with the NT condition. Stimulations and luciferase assays were carried out in two independent plates and the results are presented on each axis (with a correlation r = 0.7909, P < 0.0001) (averaged data are provided in Supplementary Table S2). The 10 most potent ASOs (reference position in the plate is given as per Supplementary Table S2) are highlighted on the plot. ASOs with ≤50% reduction of TLR9 activity at 500 nM are highlighted with blue shading. (E) Bottom: MEME pictogram of the relative frequency of bases constituting the TLR9 inhibitory motif. Top: alignment of the sequences enriched with the motif identified as per Supplementary Figure S1D. The reference position in the plate is given as per Supplementary Table S2. (F) Alignment of the sequences enriched with ASO2 motif (Supplementary Figure S1C). (G) The central 10 DNA bases of the top and bottom 16 TLR9 inhibitors from the 80 ASOs screened (see Supplementary Table S2) were analysed for base content. The violin plots show the distribution of the cumulative number of each central base for both ASO populations. Ordinary two-way ANOVA with Sidak's multiple comparison tests (between top and bottom populations) are shown. (H, J, L) HEK-TLR9 cells expressing a NF-κB-luciferase reporter were treated with 500 nM indicated ASOs for 45 min prior to stimulation or not (non-treated [NT]) with 200 nM ODN2006. NF-κB-luciferase levels were measured after overnight incubation. NF-κB-luciferase levels were normalised to the ‘ODN2006 only’ condition, after background correction with the NT condition. Data shown are averaged from three independent experiments in biological triplicate (± s.e.m). One-way ANOVA with Dunnett's multiple comparison tests to the ‘ASO2138’ condition (H), or the ‘ASO108’ condition (J), are shown. (L) One-way ANOVA with Tukey's multiple comparison tests relative to the condition ‘661’, or otherwise indicated pairs of conditions are shown. (I, K) Sequence alignments showing the ‘CUU’ motifs in families of closely related ASOs; the yellow region highlights the DNA moiety of the gapmers. (M) Correlation of TLR7 and TLR9 inhibition based on 80 ASOs (used at 100 nM for TLR7, and 500 nM for TLR9). Percentages of NF-κB-luciferase levels relative to the conditions ‘R848 without ASO’ (for TLR7) or ‘ODN2006 without ASO’ (for TLR9) are averaged from biological duplicate (averaged data are provided in Supplementary Table S2) (with a correlation r = 0.05256, P = 0.6433). Selected ASOs are indicated. *P ≤ 0.05, **P ≤ 0.01, ****P ≤ 0.0001, ns: non-significant.

