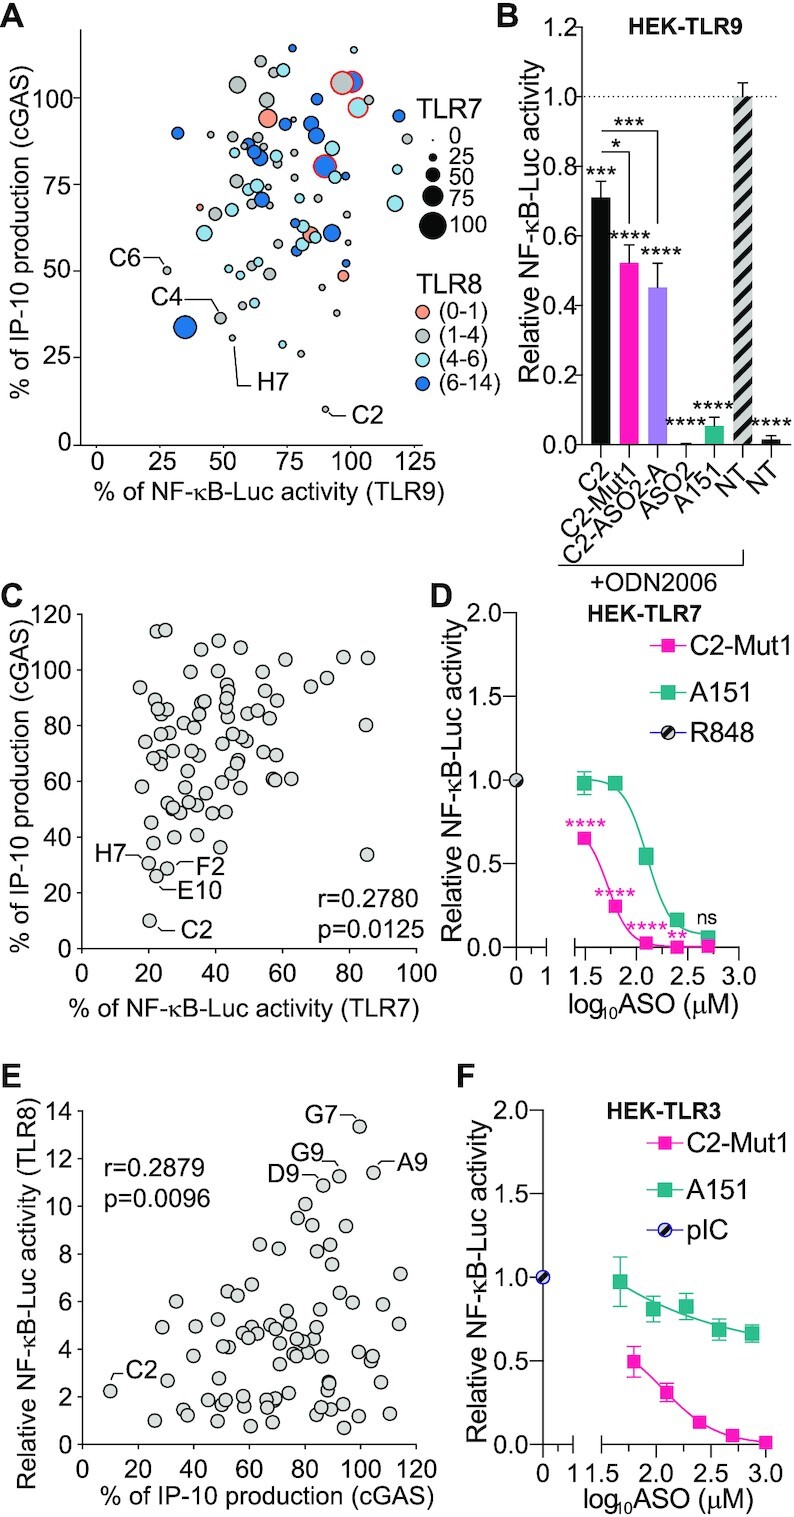
Figure 5.

The broad immunosuppressive effects of 2′OMe ASOs. (A) Bubble graph showing the relationship between cGAS, TLR9, TLR7 inhibition, and TLR8 potentiation (based on the data from Supplementary Table S2 and (21)), for 80 ASOs. For TLR7 and TLR9, percentages of NF-κB-luciferase levels relative to the conditions ‘R848 without ASO’ (for TLR7) or ‘ODN2006 without ASO’ (TLR9) are shown (the size of the bubbles reflects TLR7 signalling strength). For TLR8, fold increases relative to the condition ‘R848 without ASO’ are shown, using a 4 colour-scale. For cGAS, percentages of IP-10 production relative to the condition ‘ISD70 only’ are shown. Selected ASOs are indicated: the reference position in the plate is given as per Supplementary Table S2. (B) HEK-TLR9 cells expressing a NF-κB-luciferase reporter were treated with 500 nM indicated ASOs for 30–45 min prior to stimulation or not (non-treated [NT]) with 200 nM ODN2006. NF-κB-luciferase levels were measured after overnight incubation. NF-κB-luciferase levels were normalised to the ‘ODN2006 only’ condition, after background correction with NT condition. Data shown are averaged from three independent experiments in biological triplicate (± s.e.m and one-way ANOVA with Tukey's multiple comparison tests relative to condition ‘ODN2006 only’, or otherwise indicated pairs of conditions are shown). (C) Correlation of TLR7 and cGAS inhibition based on 80 ASOs (used at 100 nM for TLR7 and cGAS). Percentages of NF-κB-luciferase levels relative to the conditions ‘R848 without ASO’ (for TLR7) or percentages of IP-10 production relative to the condition ‘ISD70 only’ are shown (with a significant correlation r = 0.2780, P = 0.0125). Selected ASOs are indicated; the reference position in the plate is given as per Supplementary Table S2. (D) HEK-TLR7 cells expressing a NF-κB-luciferase reporter were treated with the indicated concentration of ASOs (500, 250, 125, 62.5, 31.25 nM) for 30–50 min prior to stimulation with 1 μg/ml R848. NF-κB-luciferase levels were measured after overnight incubation. NF-κB-luciferase levels were normalised to the ‘R848 only’ condition, after background correction with the NT condition. Data shown are averaged from three independent experiments in biological triplicate (± s.e.m. and ordinary two-way ANOVA with Sidak's multiple comparison tests relative to A151 are shown). (E) Correlation of TLR8 potentiation and cGAS inhibition based on 80 ASOs (used at 500 nM for TLR8 and 100 nM cGAS). Fold increases of NF-κB-luciferase levels relative to the conditions ‘R848 without ASO’ (for TLR8) or percentages of IP-10 production relative to the condition ‘ISD70 only’ are shown (with a significant correlation r = 0.2879, P = 0.0096). Selected ASOs are indicated; the reference position in the plate is given as per Supplementary Table S2. (F) HEK-TLR3 cells expressing a NF-κB-luciferase reporter were treated with indicated concentrations of C2-Mut1 (1000, 500, 250, 125, 62.5, nM) or A151 (753, 376.5, 188.25, 94.125 or 47.0625 nM) for 30–50 min prior to stimulation with 0.5 μg/ml pIC. NF-κB-luciferase levels were measured after overnight incubation. NF-κB-luciferase levels were normalised to the ‘pIC only’ condition, after background correction with NT condition. Data shown are averaged from three independent experiments in biological triplicate (± s.e.m.). *P ≤ 0.05, **P ≤ 0.01, ***P ≤ 0.001, ****P ≤ 0.0001, ns: non-significant.
