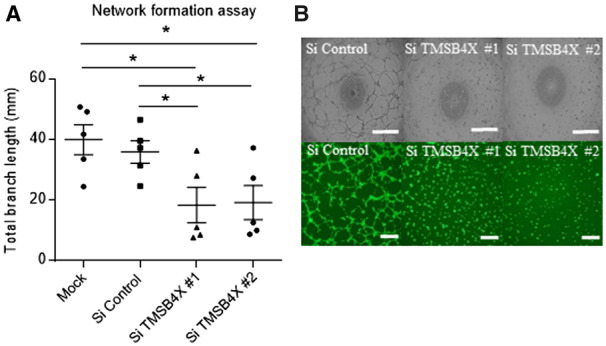
Figure 7.

Thymosin beta 4-x KD in HUVECS has a similar phenotype to LV-ΔΔATG961 overexpression on tubule formation. (A) Network formation assay in dsiRNA-mediated TMSB4X depleted HUVECs. Branch length assessed by Image J Angiogenesis plugin, n = 5, unpaired t-test. (B) Representative phase contrast and Calcein AM staining of network formation assay of depleted HUVECs. Phase contrast Scale bar = 0.5 mm. Calcein AM Scale bar = 0.1 mm. On the graphs, *P < 0.05, **P < 0.01, ***P < 0.001.
