
Figure 7.
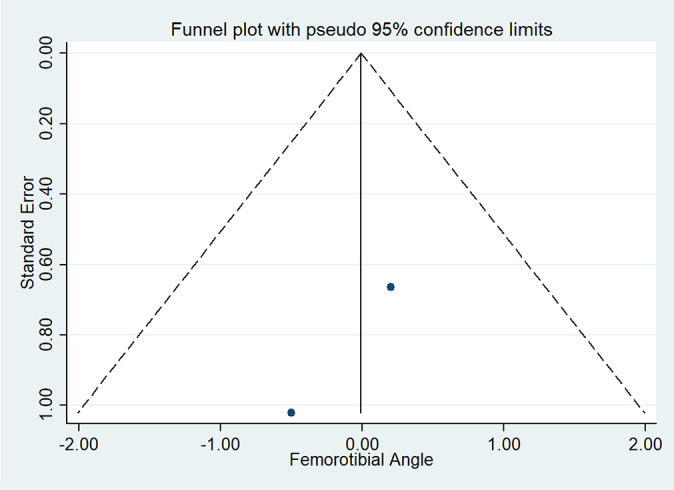
Funnel plot comparing the femorotibial angles with the SE of the studies. Each dot represents a study while the dashed lines indicate the region within which 95% of the studies are expected to lie in the absence of bias and heterogeneity.
Official websites use .gov
A
.gov website belongs to an official
government organization in the United States.
Secure .gov websites use HTTPS
A lock (
) or https:// means you've safely
connected to the .gov website. Share sensitive
information only on official, secure websites.
Funnel plot comparing the femorotibial angles with the SE of the studies. Each dot represents a study while the dashed lines indicate the region within which 95% of the studies are expected to lie in the absence of bias and heterogeneity.