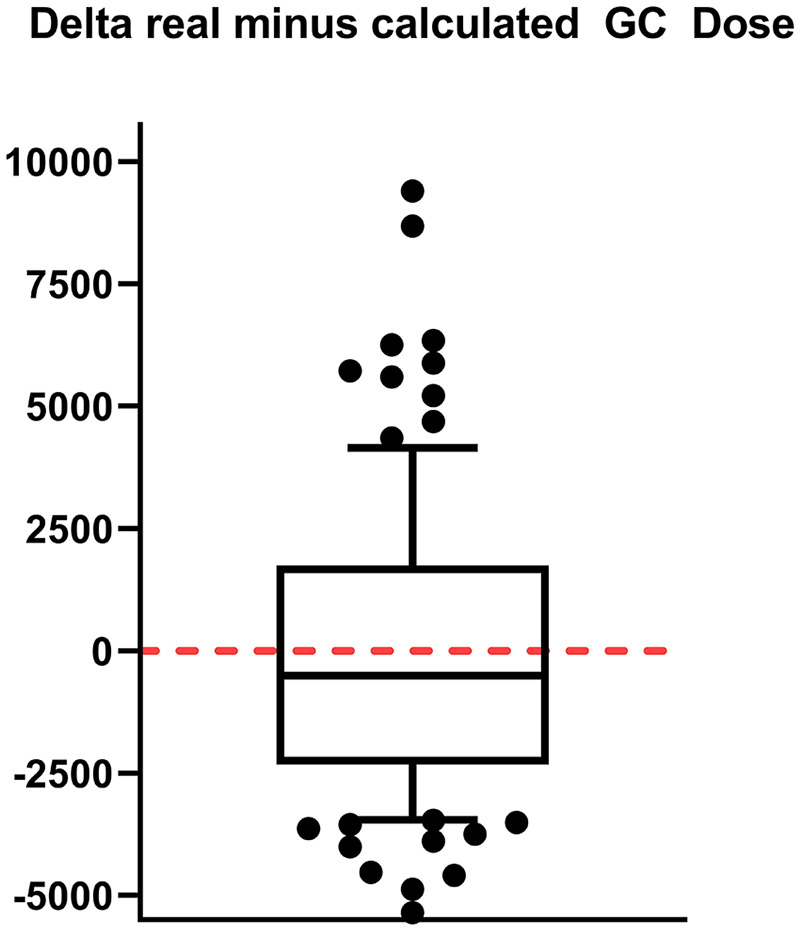
Figure 3.

For this boxplot, we took the validation cohort and subtracted from each patient the glucocorticoid dose (in mg) administered in real life from the one we calculated applying the regression analysis established in the explorative cohort. The median is shown as bar of the boxplot. The high values are rare cases with prolonged relapse symptoms, where our steroid dosing regimen was administered repeatedly (e.g. after a 7 day course of steroid administration the symptoms did not improve, but GC had been well tolerated, we would decide to administer steroids for another 5–7 days). There was no significant difference between the dosages [one sample t-test (test value 0), p = 0.173; box: median, 25–75 percentile; whisker: 10–90 percentile].
GC, glucocorticoids.
