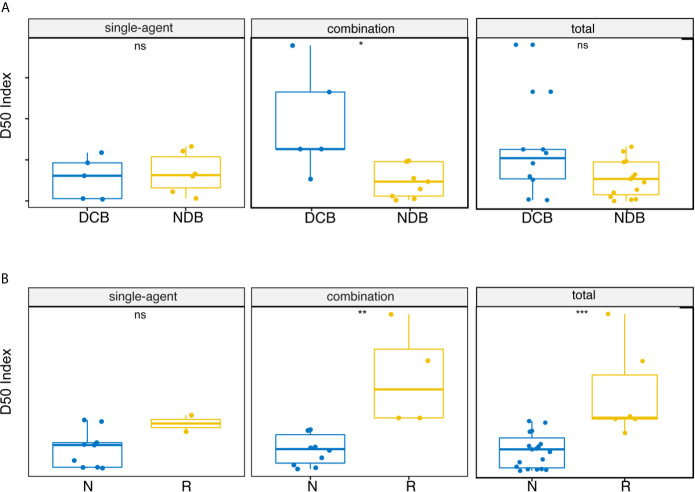
Figure 2.
Correlations between D50 index and clinical benefit. (A) Correlations between D50 index and durable clinical benefit at post-treatment samples. (B) Correlations between D50 index and response at post-treatment samples. Statistical analysis was performed using the Mann-Whitney test. Boxes depict the interquartile range with the line in boxes showing the median, and the lines outside the boxes showing the first or third quartiles of fraction. ns p >= 0.05, *p < 0.05, **p < 0.01, ***p < 0.001.

