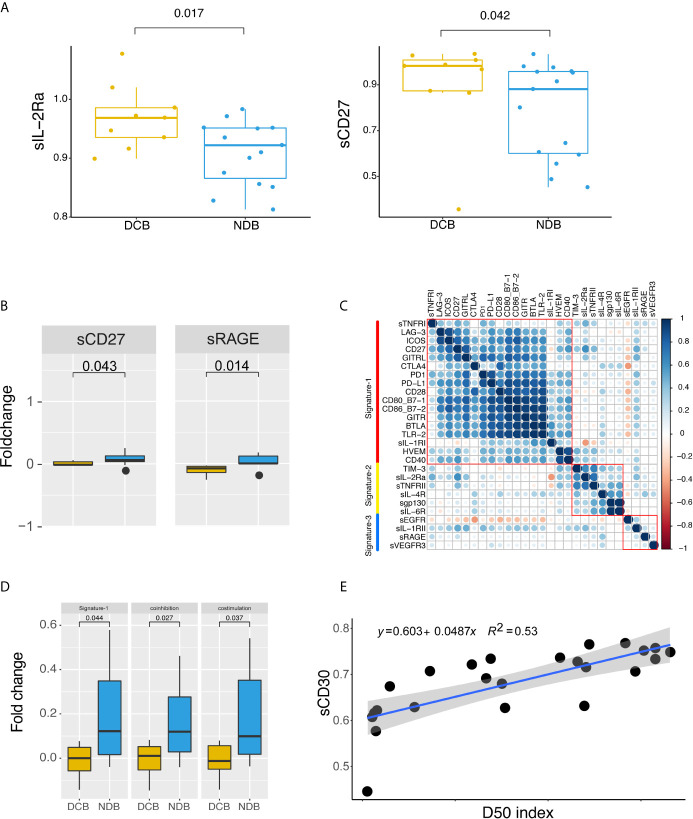
Figure 4.
Peripheral soluble receptors and ligands landscape and therapeutic outcome. (A) Different expression of soluble receptors and ligands between clinical benefit groups at baseline. (B) Dynamic changes of sCD27 and sRAGE compared between clinical benefit groups. (C) Correlation map of dynamic changes in soluble cytokine receptors and immune checkpoint protein expression. Correlations were defined using paired person correlation. (D) Signature-1 genes were differently expressed between clinical benefit groups. (E) Correlation between D50 index and sCD30. Statistical analysis of (A, B, D) was performed using the Mann-Whitney test. Boxes depict the interquartile range with the line in boxes showing the median, and the lines outside the boxes showing the first or third quartiles of fraction.

