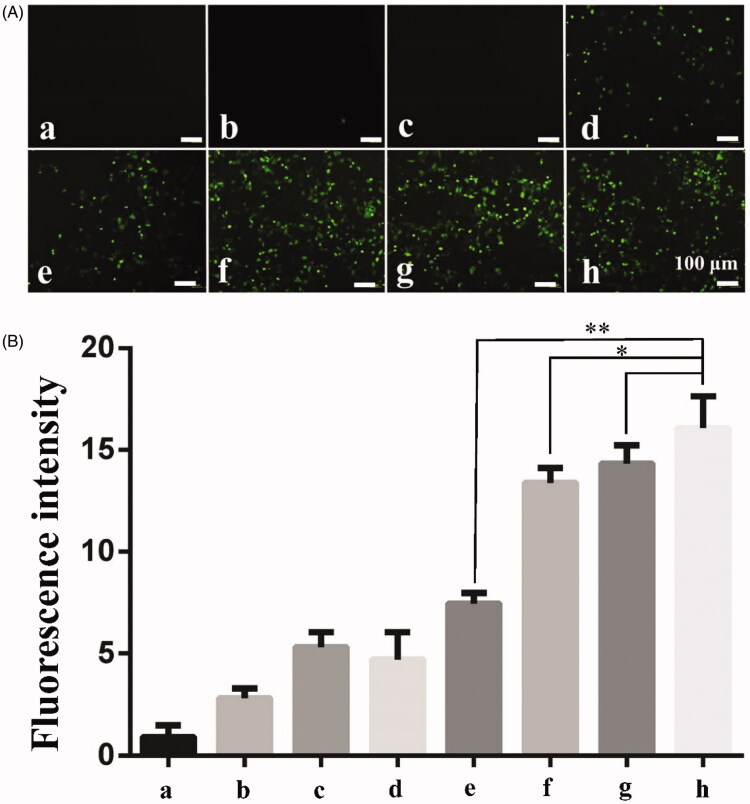
Figure 6.
Ultrasound combined with PSP@MB to promote endocytosis of 155 kDa FITC-dextran into A2780 cells. (A) Fluorescent images of 155 kDa FITC-dextran into A2780 exposed via ultrasound and PSP@MB. The experimental groups were: (a) Control group, (b) PSP@MB group, (c) US group, (d) US + PSP@MB 0.2 W/cm2 group, (e) US + PSP@MB 0.4 W/cm2 group, (f) US + PSP@MB 0.6 W/cm2 group, (g) US + PSP@MB 0.8 W/cm2 group, and (h) US + PSP@MB 1.0 W/cm2 group. The ultrasonic parameters were (1 MHz, 20% duty cycle, 1 min). (B) Fluorescence intensity was represented as histograms. Fluorescence intensity increased following the acoustic intensity increase. The relative fluorescence intensity was (16.87 ± 2.73) in the (h) group, higher than (e) group (7.53 ± 1.42) and (f) group (13.22 ± 1.85). Compared with the relative fluorescence intensity between (h) group and (g) group (14.82 ± 2.14), the difference was not statistically significant. *p < .05, **p < .01.

