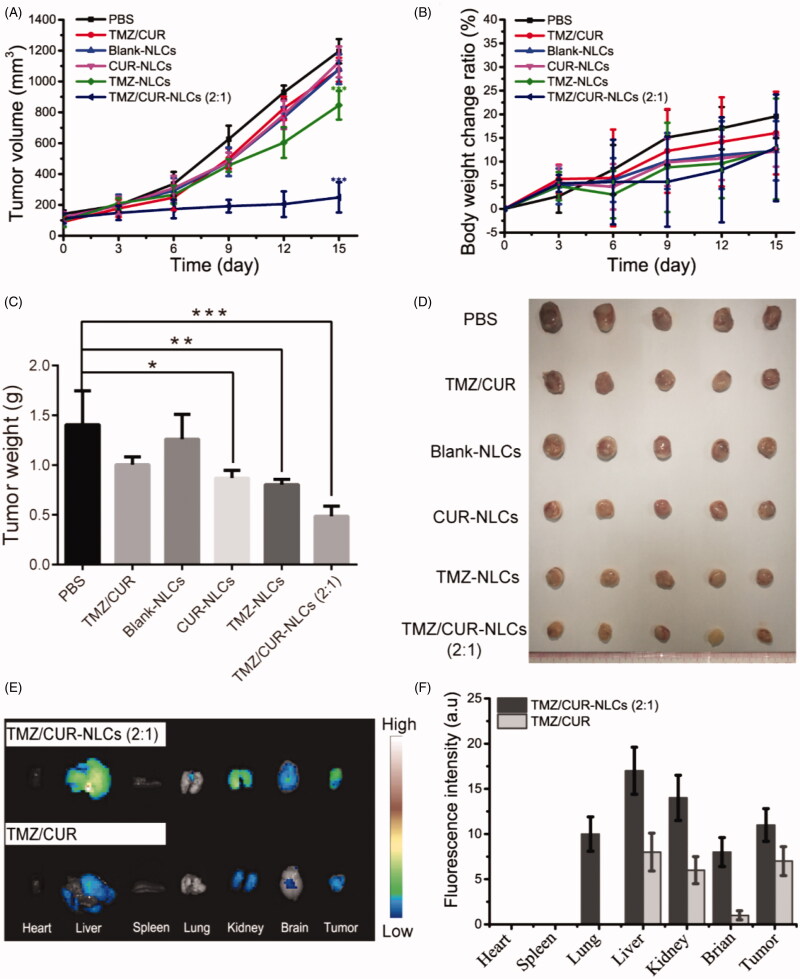
Figure 5.
(A) The tumor volume, (B) body weight change ratio and (C) the tumor weight of mice after treatment with different samples. (D) Optical images showing tumors from treated mice. (E) In vivo distribution of TMZ/CUR-NLCs (2:1) and TMZ/CUR at 24 h. (F) The fluorescence intensity of TMZ/CUR-NLCs (2:1) and TMZ/CUR in different organs. The statistical significance is expressed as ***p < .001, **p < .01, *p < .05.

