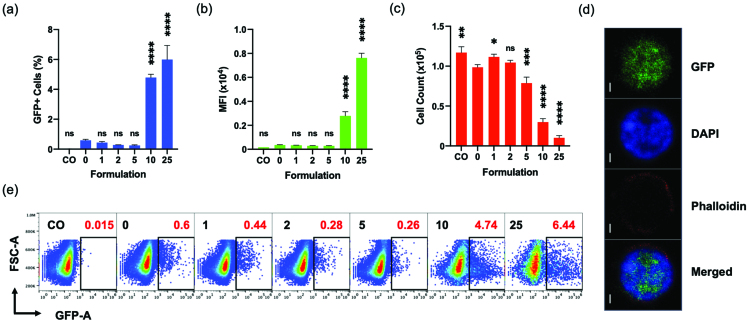
Figure 4.
Effect of CaCl2 on the transfection of Jurkat cells analyzed by flow cytometer at 96 hpt. (a, b, c, e) “CO” is a cell only control; “0”, “1”, “2”, “5”, “10”, and “25” are polyplex formulations with 0-, 1-, 2-, 5-, 10-, and 25 mM CaCl2, respectively. (d) Split view of a GFP expressing Jurkat cell from “10” captured with an oil immersion lens at 100X using Confocal Microscope LSM700; Scale bar is 1 μm. (e) Sample code and respective transfection efficiencies (red) are indicated in each square box; one of the three replicates whose transfection efficiency is closer to the mean is chosen for the plot. (a, b, c) All comparisons are made with “0”; Results are presented as mean ± SD (n = 3; 1-way ANOVA with Dunnett’s multiple comparisons, * p = .0258, *** p =.0009, **** p <.0001).

