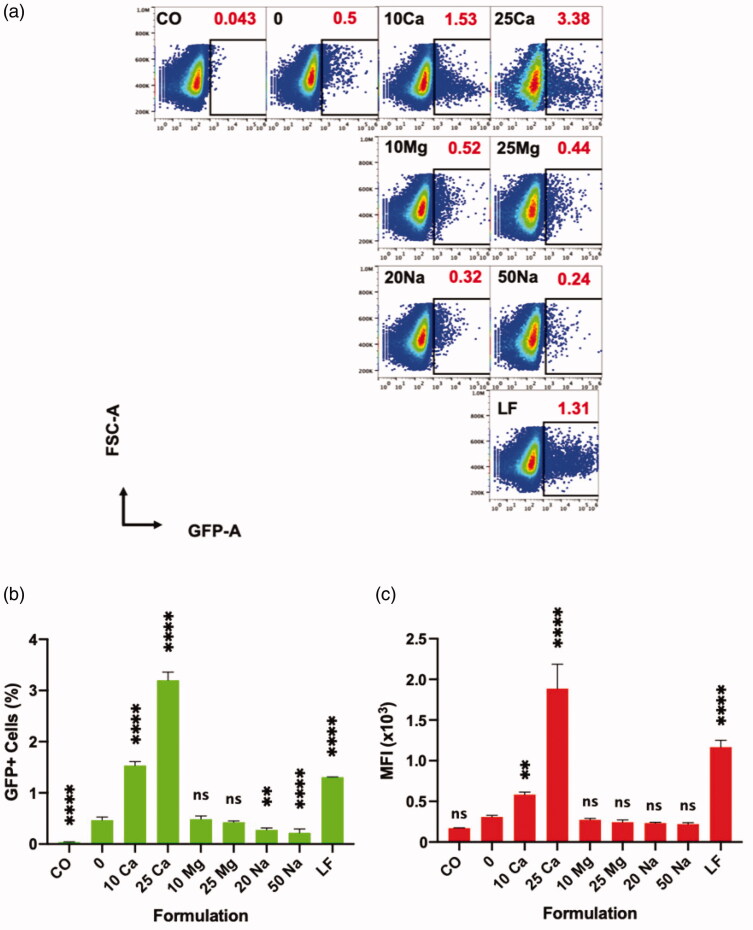
Figure 5.
Effect of various cations on transfection of polyplex on Jurkat cells, and their direct comparison to lipoplex analyzed by flow cytometer at 96 h. “CO” is a cell only control; “0” is a polyplex only control; “10 Ca” and “25 Ca” are polyplex formulations with 10- and 25 mM CaCl2, respectively; “10 Mg” and “25 Mg” are polyplex formulations with 10- and 25 mM MgCl2, respectively; “20 Na” and “50 Na” are polyplex formulations with 20- and 50 mM NaCl, respectively; and “LF” is a lipoplex condition. (a) Sample code and respective transfection efficiencies (red) are indicated in each square box; one of the three replicates whose transfection efficiency is closer to the mean is chosen for the plot. (b, c) All comparisons are made with “0” group; Results are presented as mean ± SD (n = 3; 1-way ANOVA with Dunnett’s multiple comparisons, ** p =.0017 to 0.005, **** p <.0001).

