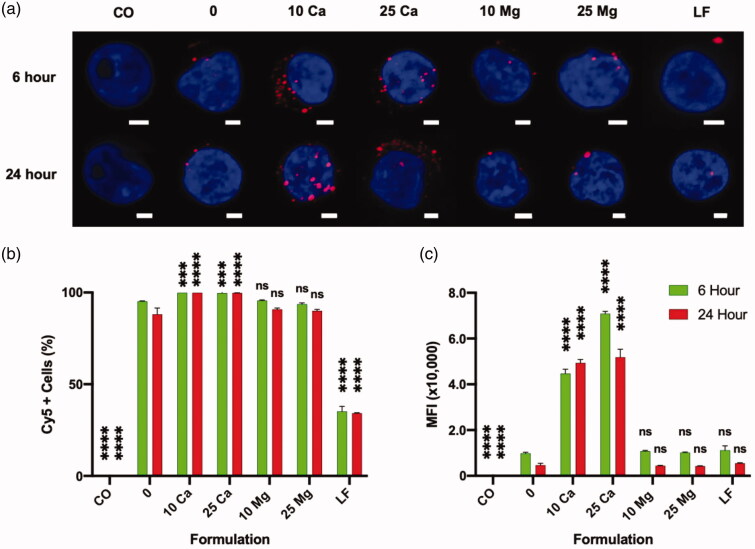
Figure 6.
Effect of CaCl2 on the association of pGFP-Cy5 polyplexes and Jurkat cells in a 48 h culture analyzed by flow cytometer. “CO” is a cell only control; “0” is a polyplex only control; “10 Ca” and “25 Ca” are polyplex formulations with 10- and 25 mM CaCl2, respectively; “10 Mg” and “25 Mg” are polyplex formulations with 10- and 25 mM MgCl2, respectively; and ”LF” is a lipoplex only condition. (a) Confocal laser scanning microscope maximum intensity projection image of Jurkat cells associated with polyplexes; Scale bar in every image is 2 μm; Nucleus is stained with DAPI (blue) and pGFP is labeled with Cy5 (red). (b, c) All comparisons are made with “0” group of respective time point; Results are presented as mean ± SD (n = 3; 1-way ANOVA with Dunnett’s multiple comparisons, *** p = .0005 and 0.0009, **** p <.0001).

