Figure 1.
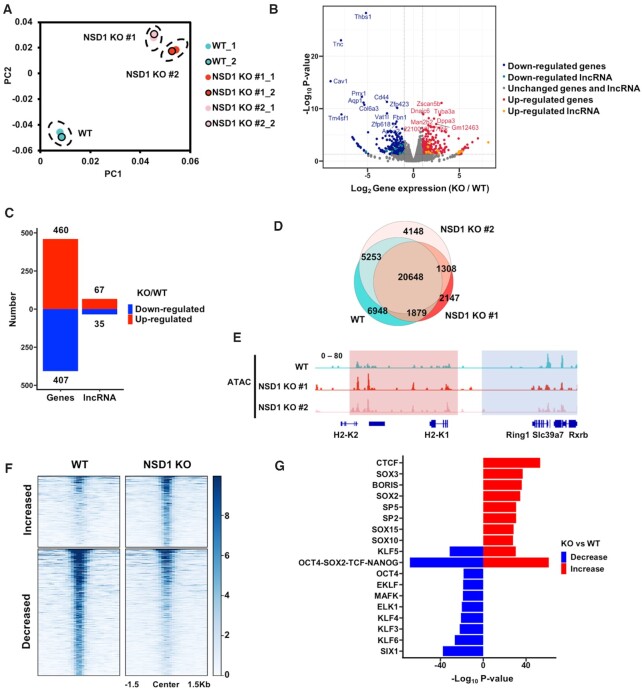
NSD1 KO in mESCs leads to both increased and decreased gene expression and chromatin accessibilities. (A) The principal component analysis (PCA) plot of the gene expression data from wild-type (WT), and NSD1 KO mESCs. NSD1 KO clones were generated from two independent sgRNAs. Two replicates of each cell line were presented. (B) Gene expression levels in wild-type and NSD1 KO mESCs. To get the reproducible results, RNA sequencing data from two replicates of each cell line were merged and two NSD1 KO cell lines were further merged. Red dots, the up-regulated genes with over 2-fold increased expression levels in NSD1 KO mESCs and P value <0.01. Blue dots, the down-regulated genes with over 2-fold decreased expression levels in NSD1 KO mESCs and P value <0.01. Yellow and cyan dots, the up-regulated and down-regulated long non-coding RNAs (lncRNAs) which were defined with the same criteria as coding genes, respectively. (C) The numbers of up- and down-regulated coding genes and lncRNAs in NSD1 KO mESCs were summarized. The criteria for the definitions of increased and decreased genes were the same as in (B). (D) Venn diagram illustrating the overlap of ATAC-seq peaks in WT and NSD1 KO mESCs. To generate reproducible results, sequencing data of two replicates from each cell line were merged. Fisher's exact statistical tests were used to analyze the overlaps of each samples. P values were <0.001 between every two samples respectively. (E) Integrative Genomics Viewer (IGV) tracks representing the signals of ATAC-seq in wild-type and two NSD1 KO mESCs. Blue box, the ATAC-seq signals were decreased in two NSD1 KO cell lines. Red box, the ATAC-seq signals were increased in two NSD1 KO cell lines. Two replicates of each cell line were merged. (F) Heatmaps illustrating ATAC-seq signals at peaks with changed reads densities. Average reads densities were calculated at each peak and peaks with different signals were selected as the P value <0.05. 503 and 897 peaks with increased and decreased ATAC-seq signals were in NSD1 KO mESCs, respectively. ATAC-seq signals from 1.5 kb upstream to 1.5 kb downstream of the peak regions (in rows) were shown on a per-peak basis (in columns). (G) Bar graph showing the enrichments of transcription factors binding motifs at altered ATAC-seq peaks. Peaks with increased and decreased ATAC-seq signals were selected as in (F) and the enrichments of vertebrates’ transcription factors motifs were analyzed at these peaks by HOMER. The top 10 motifs ranked by P value were shown.

