Figure 4.
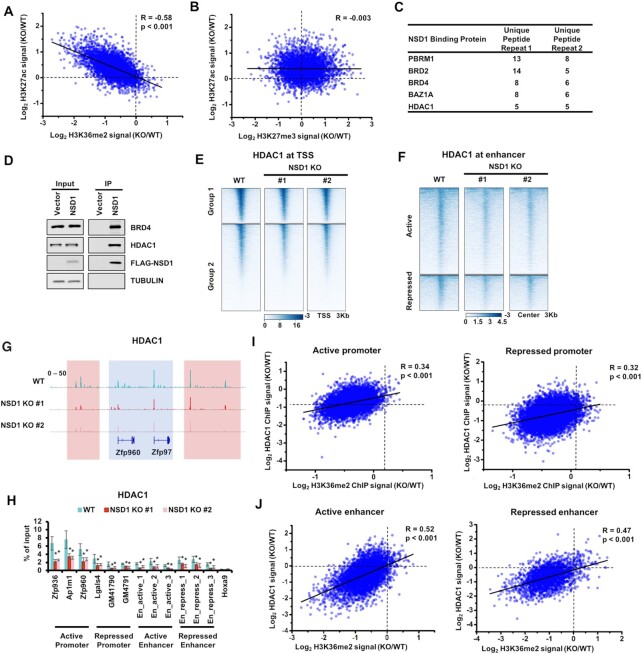
Depletion of NSD1 impairs the recruitment of HDAC1. (A) Correlations between the changes of H3K27ac and H3K36me2 at active enhancers that were within the H3K36me2 peaks in wild-type cells. Each dot indicated a single enhancer. R, correlation coefficients that were assessed by Pearson product moment correlation. (B) Same as in (A), except changes of H3K27ac and H3K27me3 were plotted. (C) Bromodomain-containing proteins and histone acetylation-associated proteins were enriched in NSD1 purification. Proteins identified in both of two replicates were shown. (D) Over-expressed NSD1 bound with BRD4 and HDAC1. NSD1 was purified from mESCs (negative control), mESCs expressing FLAG-tagged NSD1. Proteins from input and immunoprecipitated (IP) samples were analyzed by Western blotting using the indicated antibodies. (E) Heatmaps illustrating HDAC1 levels within 3 kb from transcription start sits of all genes which were determined by NCBI RefSeq. Genes were clustered by their enrichments of H3K27ac and H3K27me3. Group1 genes were with high H3K27ac and low H3K27me3. Group 2 genes were with low H3K27ac and high H3K27me3. Sequencing results of two independent replicates were merged for analysis. (F) Heatmaps showing the enrichments of HDAC1 at 3 Kb regions spanning the active and repressed enhancers. (G) IGV tracks presenting the enrichments of HDAC1 in wild-type and two NSD1 KO mESCs. The active Zfp960 and Zfp97 loci were shown. HDAC1 was enriched high in wild-type cells and decreased in NSD1 KO cells. Red box, the intergenic regions. Blue box, promoter and gene regions. (H) The enrichments of HDAC1 at the classified promoters and enhancers were analyzed via ChIP-qPCR. Three loci of active promoters, repressed promoters, active enhancers, and repressed enhancers were analyzed respectively. The repressed Hoxa9 locus was used as the negative control. The data are represented by the mean ± SD (N = 3 independent replicates). * P < 0.05 as determined by Student's t-test. (I) Correlations between the changes of HDAC1 and H3K36me2 at promoters that were within the H3K36me2 peaks in wild-type cells. Each dot indicated a single promoter. R, correlation coefficients that were assessed by Pearson product moment correlation. (J) Same as in (I), except the enhancers within the H3K36me2 peaks in wild-type cells were used for plotting.

