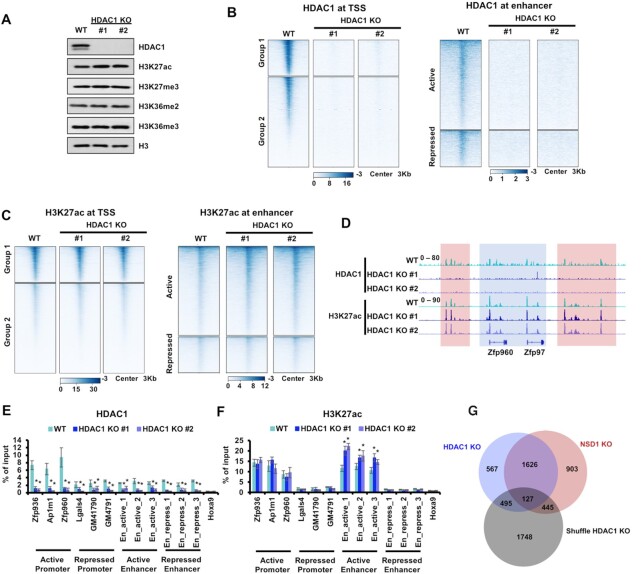
Figure 5.
HDAC1 KO increases H3K27ac at active enhancers. (A) Western blot showing the indicated protein levels in parental and HDAC1 KO mESCs. HDAC1 KO led to slightly increased H3K27ac. Cell extracts were analyzed via Western blotting using the indicated antibodies. (B) Heatmaps illustrating HDAC1 levels around TSS and enhancers. Left, 3 Kb windows from TSS of all genes as determined by NCBI RefSeq. Genes were clustered by their enrichments of H3K27ac and H3K27me3. Group1 genes were with high H3K27ac and low H3K27me3. Group 2 genes were with low H3K27ac and high H3K27me3. Right, 3 Kb regions spanning the active and repressed enhancers. (C) Same as in (B), except H3K27ac levels were illustrated. (D) IGV tracks presenting the enrichments of HDAC1 and H3K27ac in wild-type and two HDAC1 KO mESCs. The active Zfp960 and Zfp97 loci were shown. HDAC1 was enriched high in wild-type cells and abolished in HDAC1 KO cells. H3K27ac was increased in intergenic regions but not the promoter regions when HDAC1 was knocked out. Red box, the intergenic regions. Blue box, promoter and gene regions. (E and F) The enrichments of HDAC1 and H3K27ac at the classified promoters and enhancers were analyzed via ChIP-qPCR. Three loci of active promoters, repressed promoters, active enhancers, and repressed enhancers were analyzed respectively. The repressed Hoxa9 locus was used as the negative control for H3K27ac and HDAC1. The data were represented by the mean ± SD (N = 3 independent replicates). * P < 0.05 as determined by Student's t-test. (G) Venn diagram illustrating the overlap of active enhancers with increased H3K27ac in HDAC1 and NSD1 KO mESCs. Active enhancers used as the negative control were generated by shuffling the active enhancers, that were with increased H3K27ac in HDAC1 KO cells, within all active enhancers. To generate reproducible results, sequencing data of two independent clones were merged. Fisher's exact statistical tests were performed between every two samples. Only the overlap between HDAC1 and NSD1 KO showed a P value less than 0.001. Other overlaps were not significant with P values more than 0.05.

