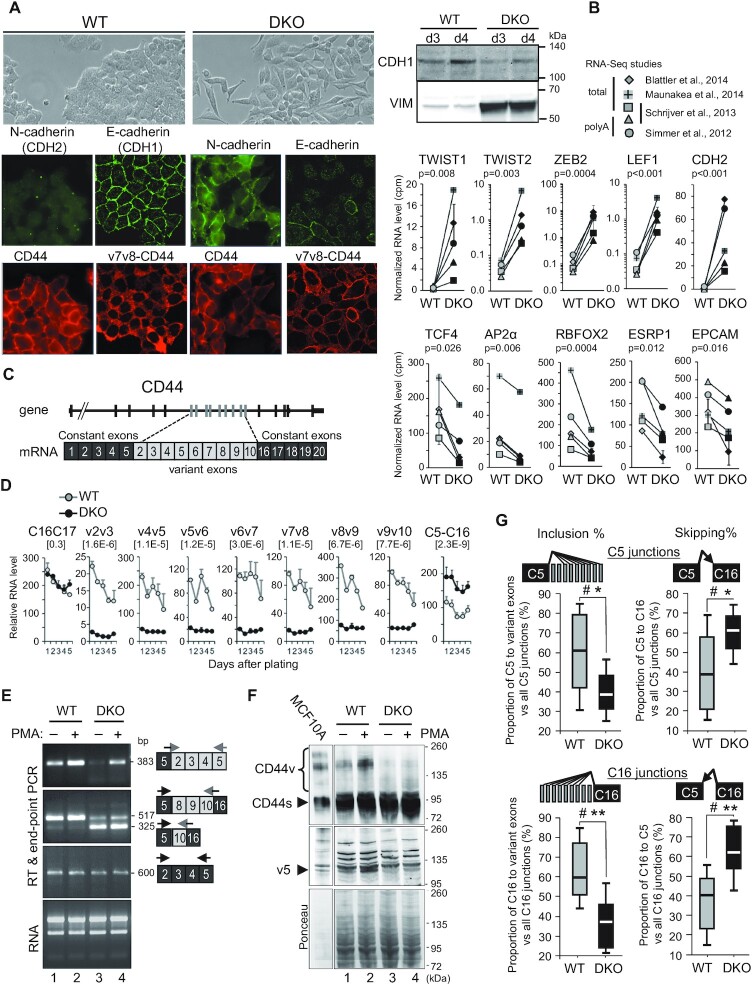
Figure 1.
Loss of DNA methylation leads to epithelial-to-mesenchymal Transition (EMT) and a decrease in variant CD44 protein isoforms. (A) Left panels: immunofluorescence analysis of WT or DKO HCT116 cells with mouse antibodies (red panels) against CD44, either with Hermes3 antibody (CD44) recognizing an epitope in the C5 exon (126) or with an antibody against v7v8 variant exons (v7v8-CD44), and analysis with rabbit antibodies (green panels) against E (CDH1) or N-(CDH2) cadherins. Right panels: western blot analysis of E-cadherin (CDH1) and Vimentin (VIM) expression levels in whole cell extracts from WT or DKO HCT116 cells, 3 and 4 days after plating as in Figure 2C which shows identical protein loading between samples. (B) RNA-seq from 4 studies were combined (n = 5 samples) and matched for studies and types of extracts. The average of duplicates from the Blatter's study has been considered as one sample. Error bars show the mean absolute deviation (dev.) (see Supplementary Figure S1C). The relative levels were cpm normalized for each librairy sizes. Statistical analysis has been carried out on Rlog (DESeq2) normalized counts using a paired t-test (two-tailed) to compare WT to DKO levels. Top and bottom panels show mesenchymal-specific and epithelial-specific genes, respectively. (C) Map of the human CD44 gene and mRNA. (D) Relative mRNA levels of CD44 variant exons in WT and DKO HCT116 cells at each indicated day after plating, analysed by RT-qPCR using primers pairs spanning at least two different exons. Relative quantities were normalized between WT and DKO for each individual day using genes with unchanged levels (RPLP0, CDK9, CCNT1 or SAM68) as a reference. Data are the averages (± dev.) of two individual experiments. Statistical significance of the differences between DKO and WT was assessed by a paired Student's t test (two-tailed) using the five matched days (n = 10). The P-values are indicated in brackets for each exon pairs. (E) RT-PCR of total RNA from WT or DKO HCT116 cells treated (+) or not (–) with PMA for 6 h. The primers and sequenced products of each PCR assay are depicted on the right with their size (bp). RT-PCR performed on constitutive exons only (black boxes) are shown as a control. (F) Whole protein extracts from WT or DKO HCT116 cells treated (+) or not (–) with PMA for 20 h, were analysed by western blot using antibodies against constant exons of CD44 (Hermes3 antibody; top panel) and against the v5 exon of CD44 (VVF8 antibody; middle panel). Ponceau staining of the membrane is shown as a loading control (bottom). A 1/10 diluted extract of MCF10A was used to indicate the size of variant CD44 isoforms (CD44v). Arrowheads highlight the constitutive CD44 isoforms and the main isoforms containing the v5 exon. (G) The inclusion of CD44 variant exons, from the RNA-Seq studies in panel B. Differential splicing was evaluated by counting the reads covering the indicated exon-exon junctions. The relative levels of each junction are indicated as the percentage of inclusion or skipping junctions among all junctions involving the C5 exon (top panels) or involving the C16 exon (bottom panels). Significance were evaluated by using Wilcoxon signed-rank test, for α = 0.05 (two-tailed). Hashtag (#) indicates that there is sufficient evidence to suggest a difference between DKO and WT cells. The differences were also evaluated using a Student's t-test for matched-samples (two-tailed), with P < 0.05 (*), P < 0.01 (**).

