Figure 2.
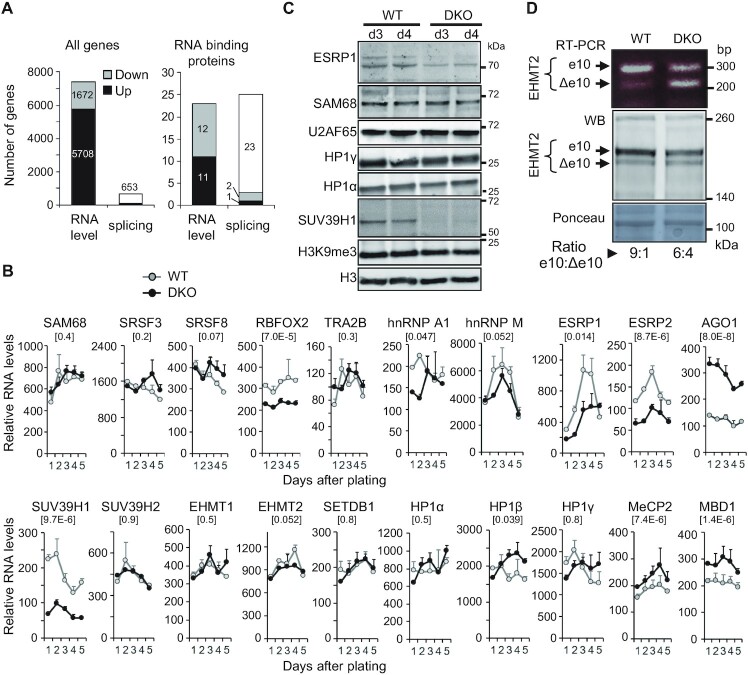
Modified expression and splicing of regulators of transcription and splicing in DKO HCT116 cells. (A) Number of genes found differentially expressed or spliced in DKO versus WT HCT116 cells in the meta-analysis of 4 independent studies containing 6 RNA-seq datasets for each cell. Genes with a log2 fold change >1 and P-value <0.05 (paired Test) were considered differentially expressed as explained in Supplementary Figure S1C, S1D. White portions of the bars indicate the genes which are not differentially expressed but found alternatively spliced. The MAJIQ package (68) was used to detect differentially spliced genes with high confidence P(|dPSI|>0.2)>0.95, (differential Percent of Splicing Index) between DKO and the parental HCT116 cells, as explained in Supplementary Figure S1F. The list of the tested RNA binding proteins is available in Supplementary Table S1. (B) Transcript levels of the indicated genes were evaluated as in Figure 1D by RT-qPCR in DKO (black line) and WT (grey line) HCT116 cells harvested over 5 days after plating. (C) Whole protein extracts from WT or DKO HCT116 cells, 3 and 4 days after plating were analysed as in Figure 1A by western blot using antibodies directed against the indicated proteins. (D) Skipping of the EHMT2 variant exon 10 in DKO cells. Top panel, semi-quantitative RT-PCR performed on total RNA to detect the inclusion of e10 or its skipping (Δe10) using previously described primers (59). Bottom panels, western blot analysis (middle) of EHMT2 isoforms in total protein extract, and ponceau-stained membrane (bottom) as a loading control. Ratio of EHMT2 protein spliced isoforms in cells were quantified by Image J using two independent sets of extracts on non-saturated images.

