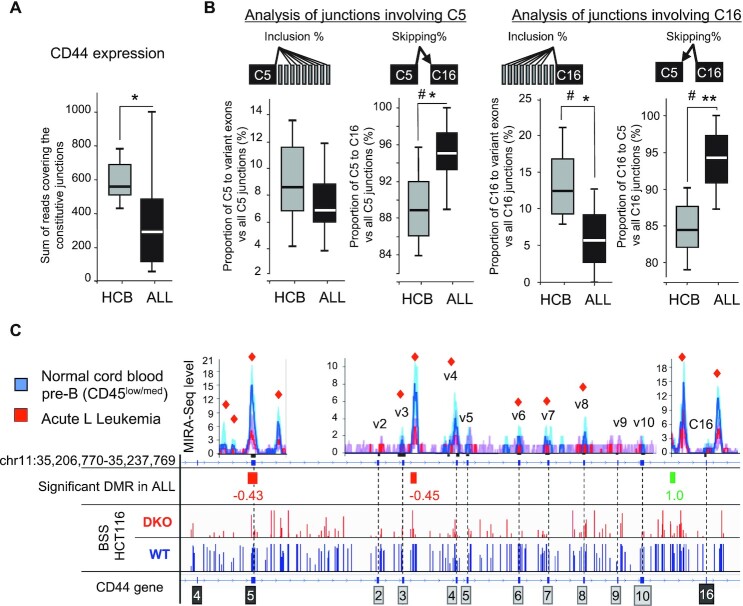
Figure 7.
CD44 variant exons are significantly less included in ALL samples compared to pre-B cells from Human Cord Blood (HCB). (A) Global expression of CD44 was evaluated by counting the total of normalized reads covering the constitutive exon-exon junctions in each of the 8 HCB control or the 9 selected ALL samples showing comparable levels of CD44 expression (Supplementary Figure S6D). (B) The proportions of skipped and included junctions were calculated by counting reads of all the junctions, detected by at least two reads, between the indicated constant exon and all the variant exons. Significance was evaluated by using Student's t test (one-tailed), where P-values are indicated as < 0.05 (*) or < 0.01 (**)). Significance was also evaluated using the Wilcoxon ranked test: where # indicates that there is sufficient evidence to suggest a difference between ALL and HCB cells with α = 0.05 (one-tailed). (C) MIRA-Seq counts, represented by bin levels (top graphs) from the 18 ALL samples(red) and the 20 pre-B samples (blue). Individual tracks are shown in Supplementary Figure S6F. The lines indicate the median while the shadowed areas represent quartiles. The red squares indicate a significant difference (P < 0.05) between bin levels. Values indicate the log2 fold change of the Differentially Methylated Regions (DMRs) in ALL versus normal pre-B after normalization and Bonferroni's correction for multi-testing P < 0.05. For comparison, genome view of Bisulphite-Seq (BBS) from HCT116 and DKO cells is shown at the bottom.

