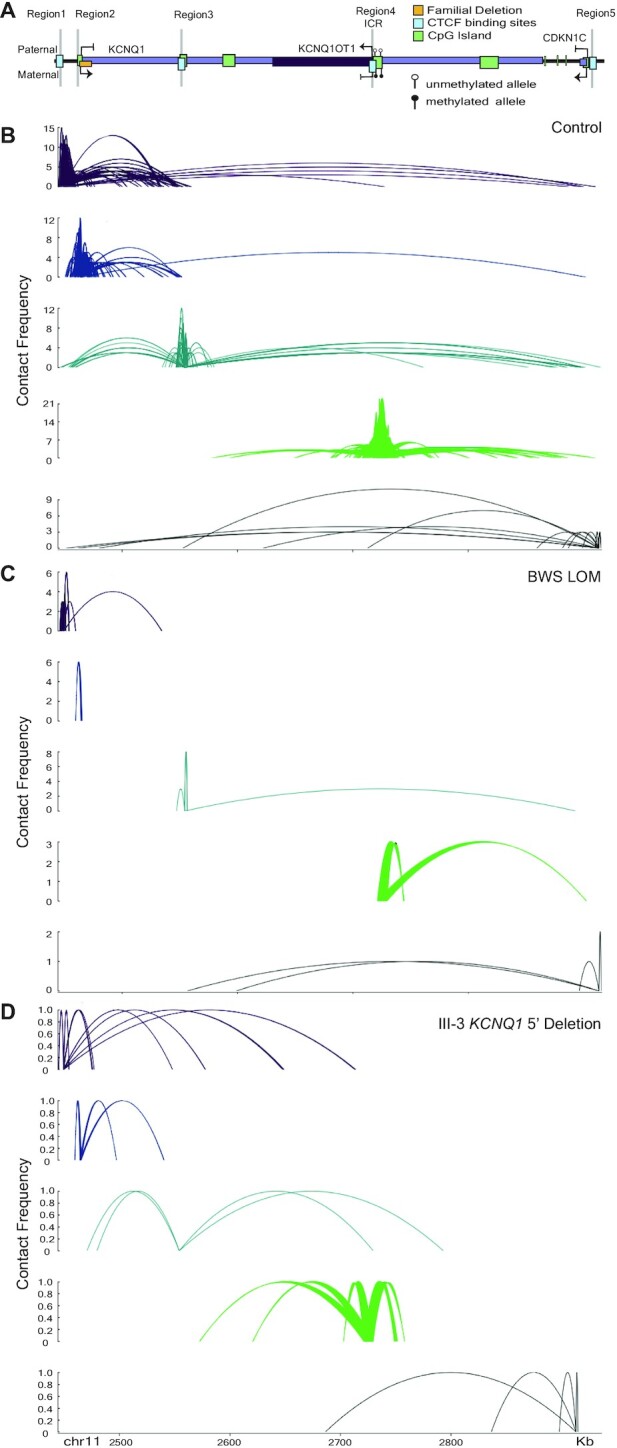
Figure 5.

Interaction profiles between 5′ KCNQ1, IC2, and 5′ CDKN1C change after BWS LOM and KCNQ1 5′ deletion. For LOM, N = 3; for control, N = 3. Splines represent interactions commonly observed between biological replicates. Contact frequency indicates the number of times an interaction was observed. (A) Simplified locus map indicating the probes for interaction capture. (B) cis interactions across the IC2 domain in control fibroblasts (N = 3) demonstrate interactions between Region1, Region3 and Region5. (C) cis interactions across the IC2 domain in BWS LOM fibroblasts are reduced, notably connectivity between Region1 and Region5 is absent. (D) cis interactions across the IC2 domain in III-3 KCNQ1 5′ deletion fibroblasts are further reduced in strength compared to BWS LOM, again lacking connectivity between Region1 and Region5.
