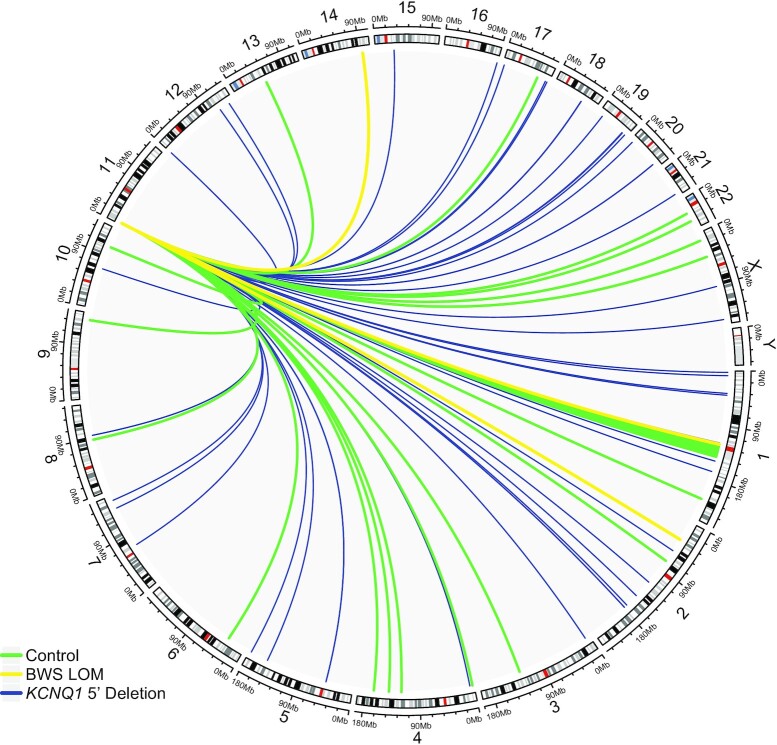
Figure 6.
Trans interactions of IC2 ICR across the genome. Trans interactome of the ICR Region4 probe are displayed. Interactions across chromosome 11 are not shown. Common features of control fibroblasts (N = 3) profile are shown in green to establish an average interactome of the ICR when imprinting is maintained. Common features of BWS LOM fibroblasts (N = 3) are shown in yellow and indicate that, when imprinting is disrupted, fewer trans interactions are made. The profile of III-3 fibroblasts carrying the KCNQ1 5′ deletion on the maternal allele is shown in blue and demonstrates a greater number as well as novel interactions across the genome when imprinting is disrupted and the structure of the imprinted domain is altered.

