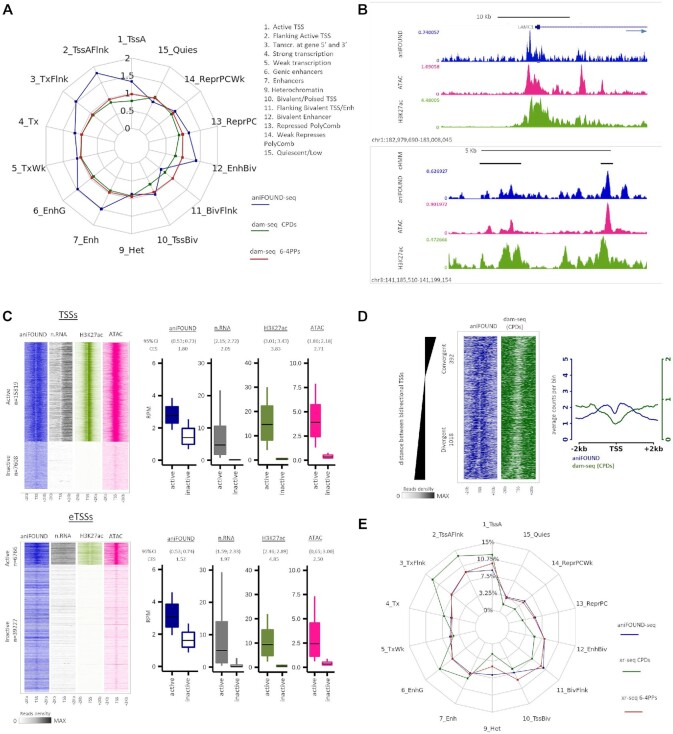
Figure 5.
Genome-wide distribution of aniFOUND-seq signal. (A) Repair and damage ratios in different chromatin states. The chromatin states are defined according to the 15-state ChromHMM annotation (see Materials and Methods). Repair ratios are calculated by aniFOUND-seq reads normalized by their input reads for each state. Similarly, damage ratios have been resulted from normalized dam-seq (20) by their inputs (see Materials and Methods). (B) UCSC Genome Browser snapshots of the signals of aniFOUND, H3K27 and ATAC-seq. Upper panel: depiction of a gene TSS and its flanking regions. The direction of transcription is shown by arrow. Lower panel: enhancers located in an area free of genes. The top track (cHMM) shows the ChromHMM states; black bars correspond to enhancers. (C) aniFOUND signal in active and inactive transcription start sites. Left panels: heat maps with the signal of aniFOUND, nRNA, H3K27 and ATAC-seq 2 kb around the transcription start sites of active and inactive genes (TSSs) and enhancers (eTSSs). The designation of human genes in active and inactive state was done as previously described (22). Right panels: Box plots with the signal distributions of the gene sets shown in the corresponding heat maps of the left panel. Boxes show the 25th–75th percentiles and error bars show data range to the larger and smaller values. For each active/inactive set, 10,000 samplings of 100 data points were randomly generated, and 95% confidence intervals of mean differences between active and inactive regions were calculated. Effect sizes of log2 counts between active and inactive sets were calculated using Cohen's method (CES). (D) DNA damage and repair on bidirectional promoters. Left panel: heat maps of aniFOUND and dam-seq around the TSSs of bidirectional genes. The sorting was done based on the distance between the TSSs of the two bidirectional genes (see Materials and Methods). Right panel: Aggregate plots of aniFOUND and dam-seq around the TSSs for the gene sets shown in the left panel. (E) Distribution of aniFOUND and XR-seq signals among chromatin states. For XR-seq all the available data sets up to 4 h after irradiation were merged (5 min, 20 min, 1 h, 2 h and 4 h for the 6-4PPs and 1 and 4 h for CPDs). The states are defined according to the 15-state ChromHMM annotation. For each library the number of reads that correspond to a chromatin state has been corrected for the length of the state. Y-axis shows the percentage of the corrected reads that fall in each state. For the hypothetical library in which all states were equally represented, a polygon with all its sides positioned at around 7% (≈ 100%/14 states) would be resulted. aniFOUND: aniFOUND-seq; dam-seq (6-4 PPs): HS-Damage-seq (6-4 PPs) (0 h after irradiation with 20 J/m2 UVC (20)); dam-seq (CPDs): HS-Damage-seq (CPDs) (0 h after irradiation with 10 J/m2 UVC (20)); nRNA: nascent RNA-seq (2 h after irradiation with 20 J/m2 UVC (29)); ATAC: ATAC-seq (2 h after irradiation with 15 J/m2 UVC (22)); H3K27ac: ChIP-seq of H3K27ac (2 h after irradiation with 15 J/m2 UVC (22)); XR-seq (CPDs): NHF1 CPD XR-seq (merged data sets of 1 and 4 h after irradiation with 10 J/m2 UVC (58)); XR-seq (6-4PPs): NHF1 (6-4)PP XR-seq (merged data sets of 5 min, 20 min, 1 h, 2 h and 4 h after irradiation with 20 J/m2 UVC (58)).

