Figure 6.
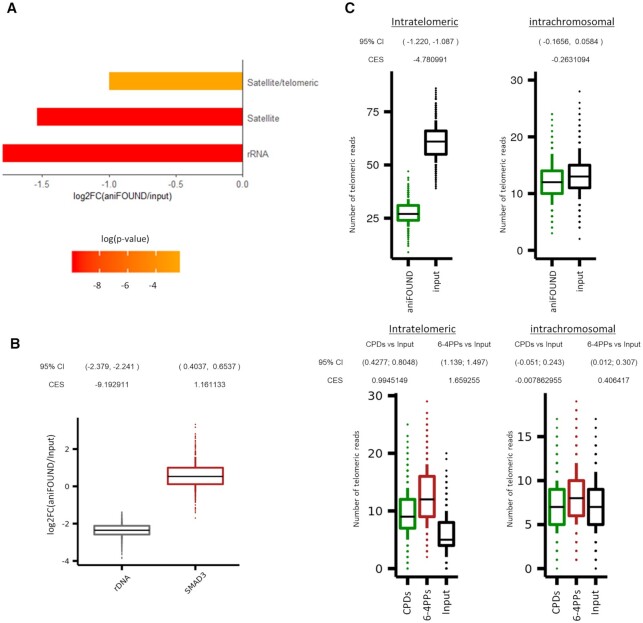
aniFOUND-seq on repeats. (A) Differentially represented repeat families between aniFOUND-seq and input libraries. The bars show the log2 ratio of the aniFOUND-seq library reads over the input library reads that are annotated to the same repeat family. The repeat families are defined according to the classification system of Repbase. The color of each bar denotes its adjusted p-value. Only families with an adjusted P-value lower than 0.05 are shown. (B) Distributions of mapped read ratios on rDNA and SMAD3 gene between aniFOUND and input libraries. On Y-axis, the logarithmized fold change of 1000 random samples is shown. For each random sample the reads were aligned on an extended reference genome consisting of the UCSC hg19 and a single copy of the human rDNA (NR_046235) sequence (see Materials and Methods). Effect sizes refer to the difference from zero of the distributions depicted by the box plots and were calculated by using Cohen's method (CES). (C) Random samples of UDS (upper panel) and DNA damage (lower panel) signal on telomeres as estimated with aniFOUND-seq and damage-seq, respectively (see Materials and Methods). Y-axis shows the number of telomeric reads that resulted from 1000 TelomerHunter runs on samples with 100,000 alignments each (see online methods). For both aniFOUND-seq and damage-seq, pull-down and input libraries have been plotted. 95% Confidence Intervals (95% CI) of log2 differences between pull-down and input libraries were calculated using 10,000 samples of 100 data points from each examined library. Effect sizes were calculated using Cohen's method (CES). damage-seq (CPDs): HS-Damage-seq (CPDs) [0 h after irradiation with 10 J/m2 UVC (20)]; damage-seq (6-4PPs): HS-Damage-seq (6-4 PPs) [0 h after irradiation with 20 J/m2 UVC (20)]; damage-seq (input): NHF1_input (20).

