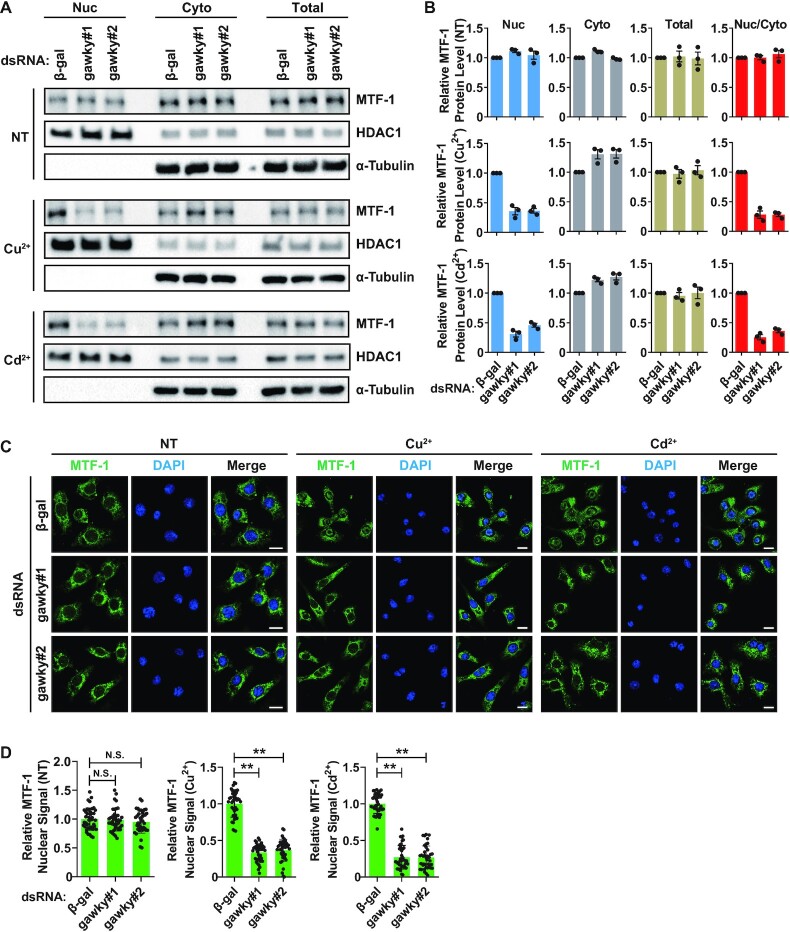
Figure 6.
Gawky controls nuclear import of metal-activated MTF-1. (A–D) S2 cells were treated with 500 μM copper or 50 μM cadmium for 12 h. (A, B) Proteins from nuclei (Nuc), cytoplasm (Cyto), or whole-cell extracts (Total) were subjected to western blotting analyses. HDAC1 served as a marker for the nuclear fraction. α-Tubulin served as a marker for the cytoplasmic fraction. Representative blots are shown. The level of MTF-1 protein was quantified using ImageJ from three independent western blotting experiments. The Nuc/Cyto ratio of MTF-1 was also calculated. Data were normalized to the β-gal dsRNA sample and are shown as mean ± SEM. n = 3. (C, D) Confocal microscopy analyses of MTF-1 were performed with anti-MTF-1. Representative images are shown. Scale bars, 8 μm. n = 3. (D) Statistics of nuclear MTF-1 signal in each condition. Data were normalized to the β-gal dsRNA sample and are shown as mean ± SEM. n = 40 cells for each condition. ∗∗P < 0.01; ∗P < 0.05.

