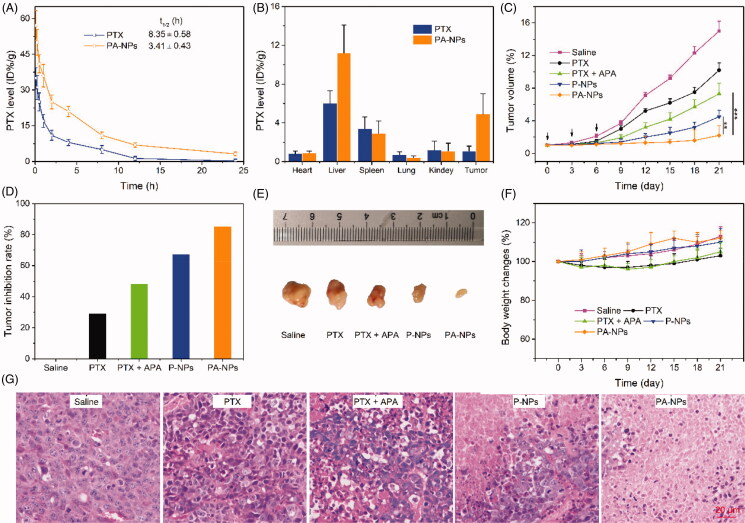
Figure 6.
In vivo experiments. (A) In vivo pharmacokinetics of PTX and PA-NPS in SD rats. The PTX level was calculated as % injected dose per gram of tissue (% ID/g, n = 5). (B) Biodistribution of PTX and PA-NPS in MCF-7/ADR tumor-bearing mice. The PTX level was calculated as %ID/g (n = 5). (C–F): (C) tumor growth curves; (D) tumor inhibition rate; (E) tumor images; and (F) curve of body weight changes in MCF-7/ADR tumor-bearing mice treated with saline (control), PTX, PTX + APA, P-NPs, and PA-NPs (n = 6, **p < .05, ***p < .001). (G) Representative H&E-stained tumor slice images acquired at 20× objective.

