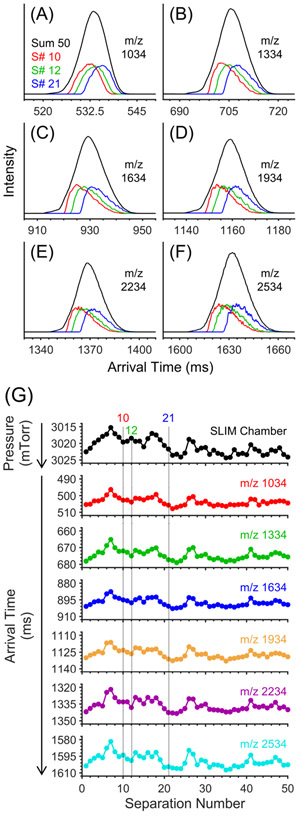
Figure 1.
Expanded views of negative Agilent tuning mixture ions acquired using 4 ion levels of a multilevel SLIM. (A) m/z 1034, (B) m/z 1334, (C) m/z 1634, (D) m/z 1934, (E) m/z 2234, and (F) m/z 2534. Each panel shows traces illustrating the sum of 50 separations (black) as well as three individual separations out of the set of 50 (red = 10, green = 12, blue = 21). (G) Average pressure fluctuations inside the SLIM chamber (black) and the associated shifts in arrival time distributions for ions with m/z 1034 (red), 1334 (green), 1634 (blue), 1934 (orange), 2234 (purple), and 2534 (light blue). Note that the y-axis is reversed in part G. Pressure measurements were performed at 10 Hz. Each point represents the average of all pressure measurements performed in single separation. TWse speed =192 m/s. TWsep amplitude = 25 V. TWesc speed = 24 m/s. TWesc amplitude = 20 V. Guard = −37 V. Injection time = 40 ms in-SLIM accumulation. Buffer gas = helium. Descriptions of typical SLIM operation and terminology can be found in refs 3, 4, 45, and 46.

