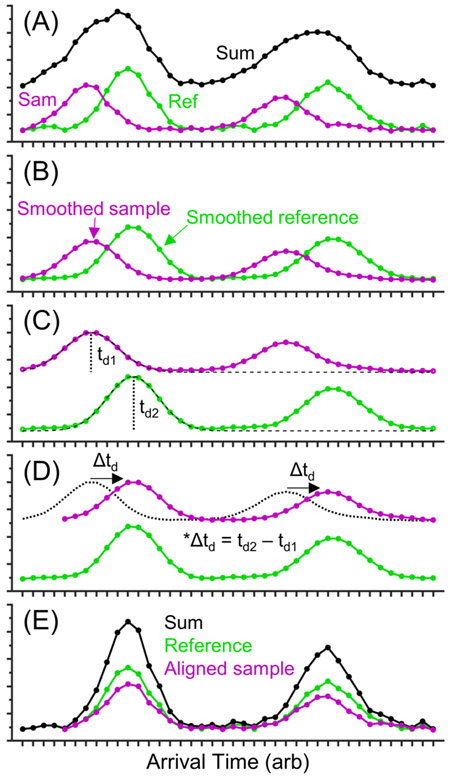
Figure 2.
Workflow of the SVA tool. (A) Examples of a sample [pink] and a selected reference [green] mobility spectrum containing two peaks and their sum [black]. Data processing involves (B) smoothing data with a 7 point moving average, (C) using a Gaussian fitting function to find peak centers, (D) finding the difference in peak centers between the sample and reference spectra and shifting the sample spectrum by the difference, and (E) summing the raw, aligned mobility spectra. In application, all spectra are individually shifted relative to the reference spectrum by the SVA tool. The improvement can be seen by comparing the “sum” spectra in panels A and E.

