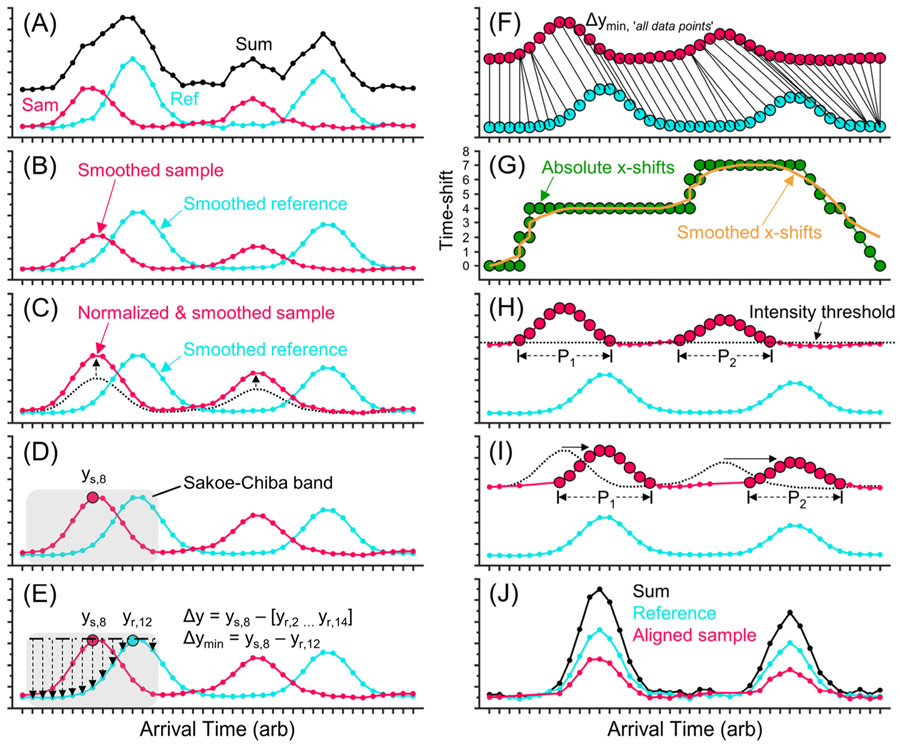
Figure 4.
Workflow of the dynamic time warping (DTW) algorithm. (A) Examples of sample (red) and reference (light blue) mobility spectra composed of 40 points each and containing two Gaussian peaks. (black) Sum of the raw sample and reference spectra. Data processing first involves (B) smoothing data using a 7 point moving average and (C) normalizing the intensity of the sample data to the reference data. (D) An individual point in the sample data chosen and a constraining range (e.g., Sakoe–Chiba band) in the time domain is chosen (e.g., 6 points on either side, gray highlight). (E) The differences in intensity values are found (i.e., Euclidean distances), and the smallest difference out of the group is identified (e.g., ys,8 → yr,12). (F) Steps D and E are repeated for all data points in the sample spectrum. (G) The corresponding time domain shift is found for each of the smallest Euclidean distances (green), and a moving average of the time domain shifts (yellow trace) is performed. (H) Peaks in the sample spectrum are identified by setting an intensity threshold and defining all points above that threshold that are grouped as a peak. (I) The points defined as a peak are shifted using the average time domain shift of all points comprising the peak. All other points are shifted by the smoothed trace. (J) Aligned sample and reference spectra and their sum. In application, all spectra are individually shifted relative to the reference spectrum by the DTW tool. The improvement can be seen by comparing the “sum” spectra in panels A and J.

