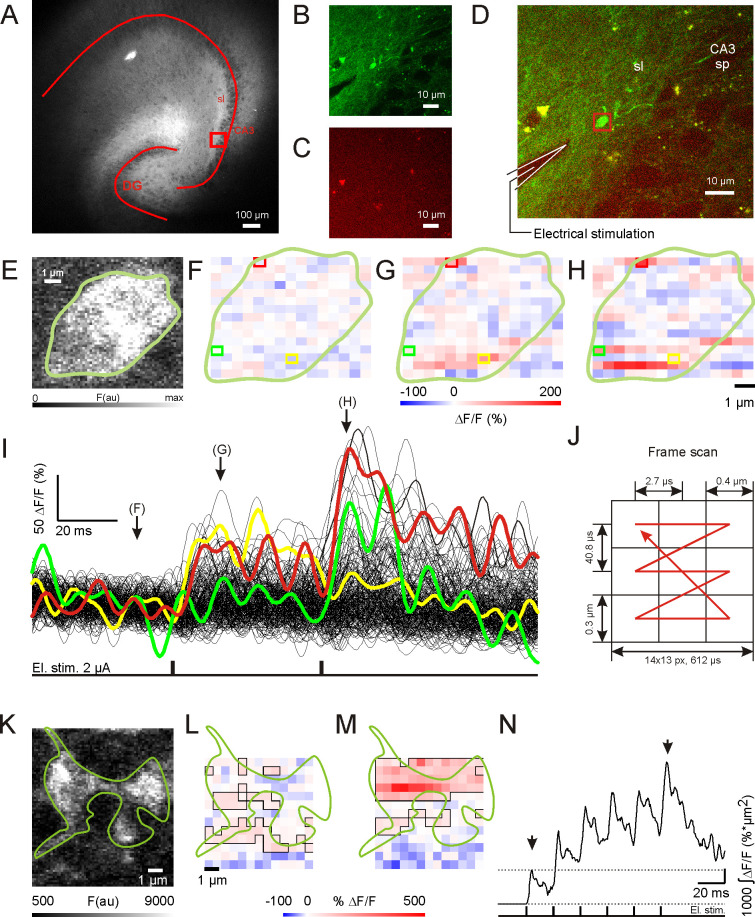
Fig 1. Two-photon imaging of single hippocampal mossy fiber bouton (hMFB) iGluu transients.
(A) Fluorescent image of an organotypic hippocampal slice culture 3 wk after transfection with the genetically encoded glutamate sensor iGluu in dentate gyrus (DG) granule cells. The square shows the region in (B–D). DG and CA3 are outlined by overlay. sl, stratum lucidum. (B) iGluu fluorescent signal acquired by 2-photon imaging in stratum lucidum (average of 15 frames). (C) Image of nonspecific autofluorescence with emission > 600 nm. (D) Composite of (B) and (C). The red rectangle marks the recorded area of the hMFB shown in (E). Note the position of the stimulation electrode indicated by the drawing. sp, stratum pyramidale. (E) High-resolution image illustrating the hMFB shown in (B) and (D) immediately before the high-speed imaging recordings. A hand-drawn green curve contours the bouton. (F–H) Single frames of the same hMFB showing ΔF/F signals at rest (F) and at the peak response after the first (G) and second (H) electrical stimulation in control conditions. The green line in (F–H) contours the hMFB silhouette shown in (E). Colored boxes represent pixels for which the intensity plots are shown in (I). (I) Plot representing dynamic ΔF/F fluorescent signals for each pixel in (F–H). Colored traces represent signals from pixels in colored boxes in (F–H). (J) Scheme illustrating the 2-photon laser scanning pattern with mean spatiotemporal resolution characteristics. (K) High-resolution image of a hMFB used for high-frequency stimulation experiments. The bouton contour was manually outlined by a green line. (L and M) Single frames of the hMFB illustrated in (K) showing ΔF/F signals at the peak response after the first (L) and sixth (M) electrical stimulation in control conditions. The green line shows the hMFB location. Contoured pixels represent active area. Note elevated pixel intensity and active area after 50-Hz stimulation. (N) The trace represents cumulative response dynamics for the given hMFB example in (K–M). The arrows indicate time points taken for illustration in (L) and (M). Note the almost 4-fold increase in cumulative ΔF/F signal after the last stimulation compared to the first, which illustrates the operating range of the iGluu sensor. El. stim., electrical stimulation. The data underlying this figure can be found at doi: 10.5281/zenodo.4498214.

