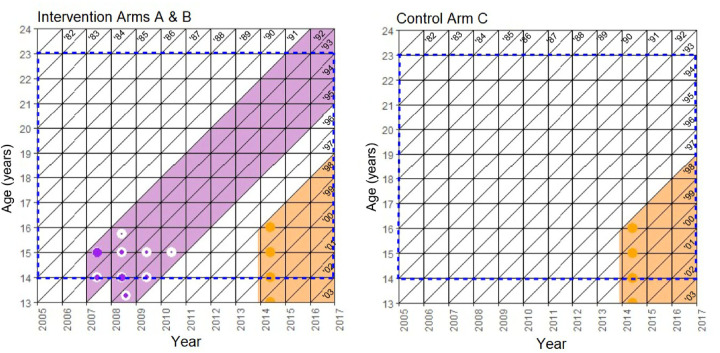
Fig 1. Lexis diagrams depicting the community-level exposure of the adolescent population to direct and indirect effects of the cluster-randomized human papillomavirus vaccination trial by birth cohort and study arm.
hite bars represent the birth cohorts with no vaccination, and the purple (trial vaccination) and orange (national vaccination) bars represent post-vaccination birth cohorts. The blue dashed lines indicate the sampling years and ages of this study. The colored fill of the symbols indicates the proportion of each type of vaccination that took place at that time point and age per birth cohort.

