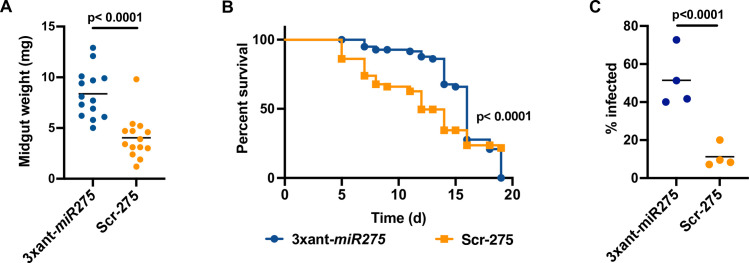
Fig 2. Gut physiological homeostasis is compromised in Gmm3xant-miR275.
(A) Tsetse gut weights. The gut weights were measured 24 h after the last blood meal. Each dot represents an individual fly gut. Mann-Whitney test was used for statistical analysis. (B) Serratia infection assay. A total of 4 biological replicates (n = 25 flies per replicate) were used. Gehan-Breslow-Wilcoxon test was used to determine statistical significance. (C) Trypanosome midgut infection prevalence. Four biological replicates (n = 20 flies per replicate) were used. Generalized linear model (GLM) with binomial distribution was used to determine statistical significance.

