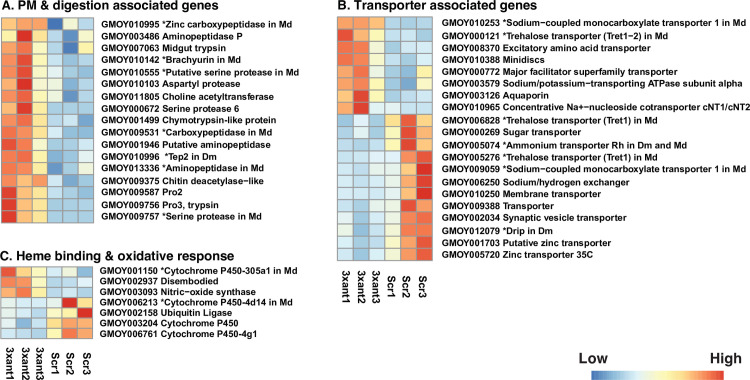
Fig 6. Heat map representation of DE genes in different functional groups (A-C) in the midgut of Gmm3xant-miR275 and GmmScr-275 flies.
(A) PM and digestion associated, (B) transporter associated, and (C) heme binding and oxidative response associated. Heat maps were generated by plotting the read counts in in treatment (3xant-miR275) and control (Scr-275) samples. Colors display normalized gene expression values from low (blue) to high (red). * indicates the unknown gene product’s orthologue in Drosophila melanogaster (Dm) and/or Musca domestica (Md).

