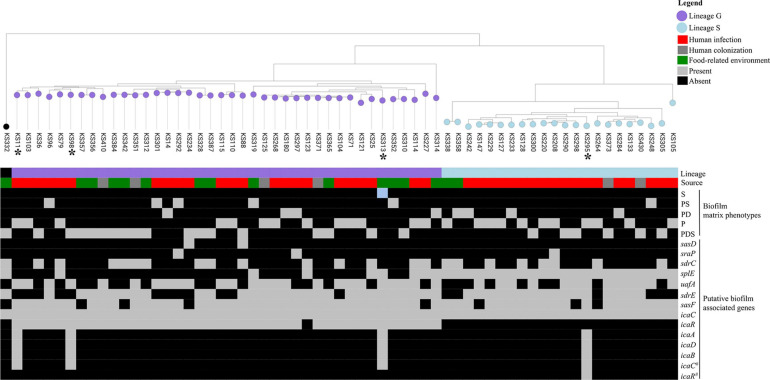
FIGURE 3.
Maximum likelihood tree of 63 Staphylococcus saprophyticus strains showing the source, genetic lineages, matrix components of biofilm, and distribution of virulence genes. Distribution of five main biofilm matrix phenotypes produced by S. saprophyticus including S, polysaccharide; PS, protein–polysaccharide; PD, protein–eDNA; P, protein; and PDS, protein–eDNA–polysaccharide is shown. Isolates marked with asterisks carried additional ica genes (icaA, icaD, and/or icaB). Each node represents different strains, and nodes with the same color belonged to the same lineage. The tree was constructed from the core-genome single-nucleotide polymorphism (SNP) alignment without recombination by RAxML using general time reversible model and 100 bootstrap values for node support. A comparison figure was generated using microreact.

