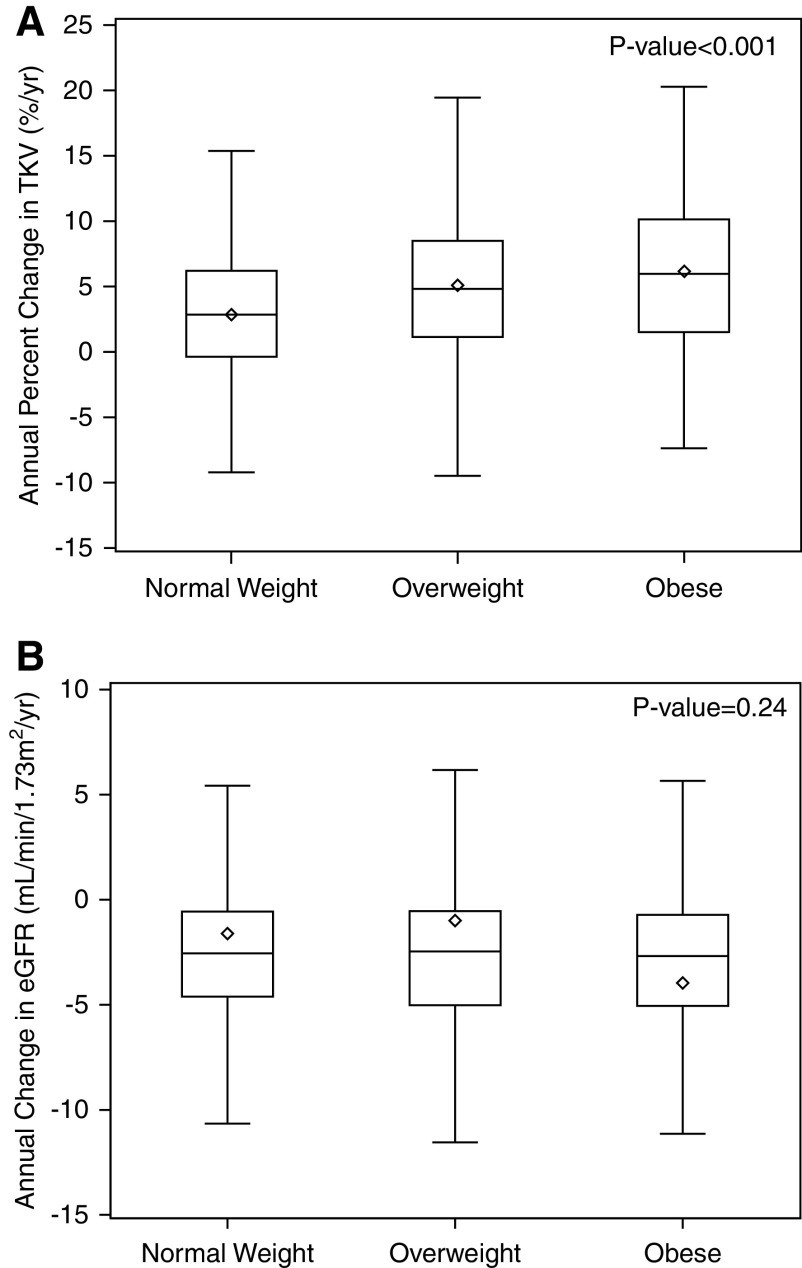
Figure 1.
Annual percent change in total kidney volume and eGFR according to baseline body mass index categories. Annual percent change in total kidney volume (TKV) is greater with overweight or obesity compared with normal weight (A), whereas annual change in eGFR does not differ (B). The bottom and top edges of the boxes indicate the interquartile range, the line represents the median, the diamond represents the mean, and the whiskers are drawn from the box to the most extreme point that is ≤1.5 times the interquartile range.

