
Figure 1:
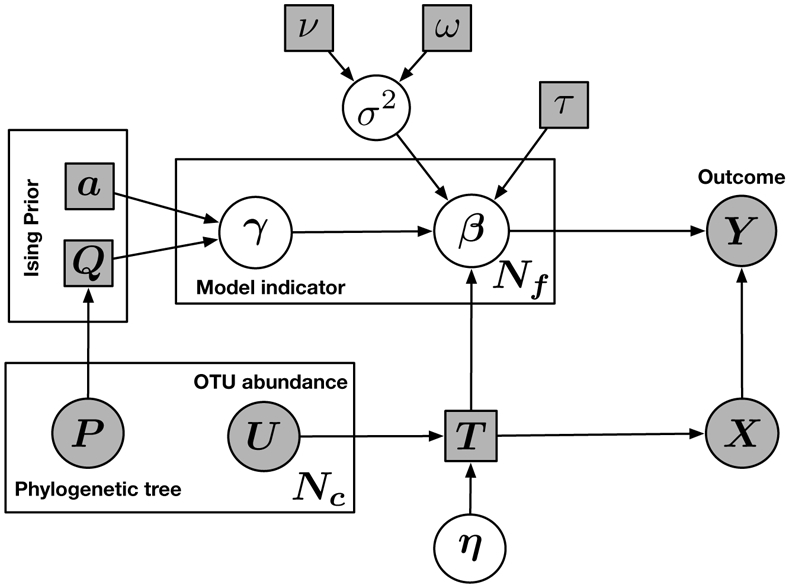
Schematic illustration of the proposed model. Squares indicate fixed parameters; circles indicate random variables. Filled-in squares indicate known values. Filled-in circles indicate observed data. T denotes the transformation matrix. η denotes constrained linear coefficients, while β denotes the unconstrained linear coefficients after transformation. X denotes the transformed covariates. The prior variance of each β is denoted by σ2, which is assumed to follow an Inverse Gamma distribution with hyperparameters ν and ω. τ denotes the variance scale of β. Nc denotes the number of covariates. Nf denotes the number of unconstrained parameters. In the Ising prior, a denotes shrinkage parameter, and Q denotes the dependence structure.