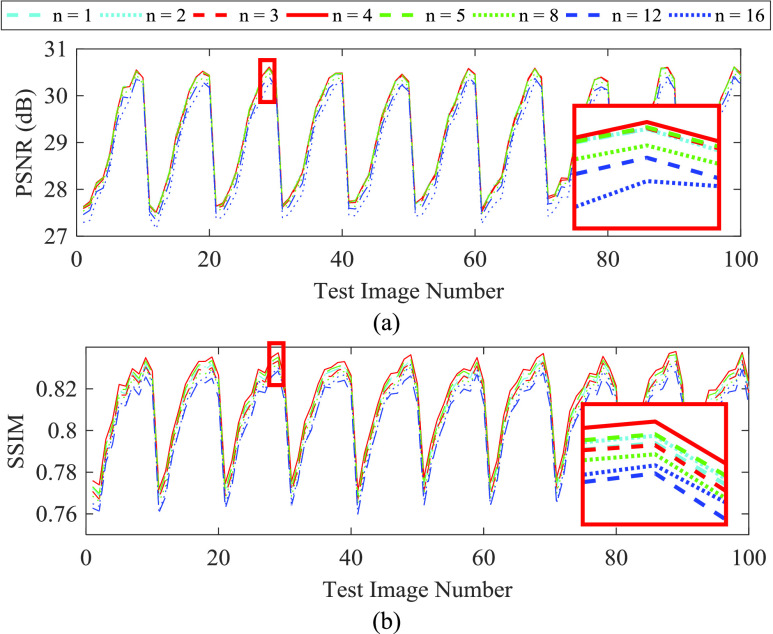
FIGURE 3.
Image quality performance of ACNS according to the number of nonlinear mapping layers  : (a) PSNR and (b) SSIM results. A cyan dashed, cyan dotted, red dashed, red solid, green dashed, green dotted, blue dashed, and blue dotted lines correspond to
  of 1, 2, 3, 4, 5, 8, 12, and 16, respectively. For visibility, we magnified a region with a red rectangle.

