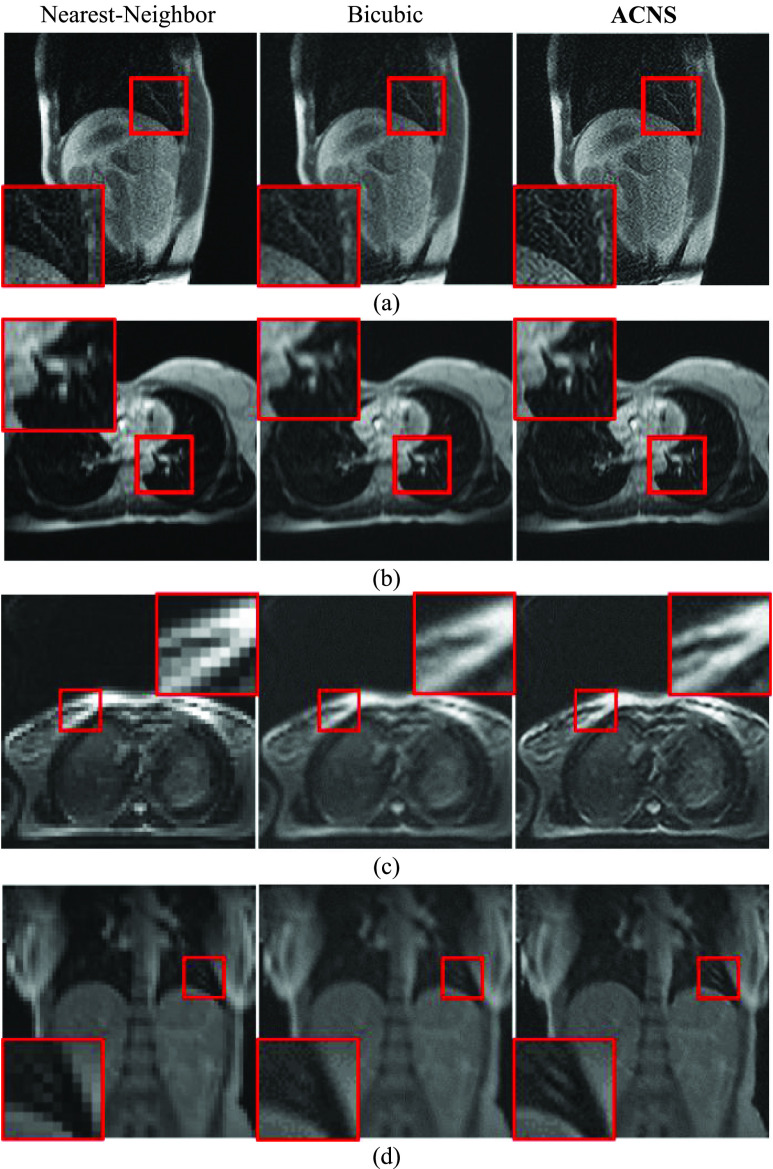
FIGURE 6.
MRIs enlarged by ACNS: (a) Volunteer1, (b) Volunteer2, (c) Volunteer3, and (d) Volunteer4 datasets. Each MRI was randomly selected. The first and second columns are the original MRIs magnified by nearest-neighbor interpolation and bicubic upsampling, and the third column is the resulting MRIs from ACNS, at a  of 3. We magnified the area in the red square to show more details.

