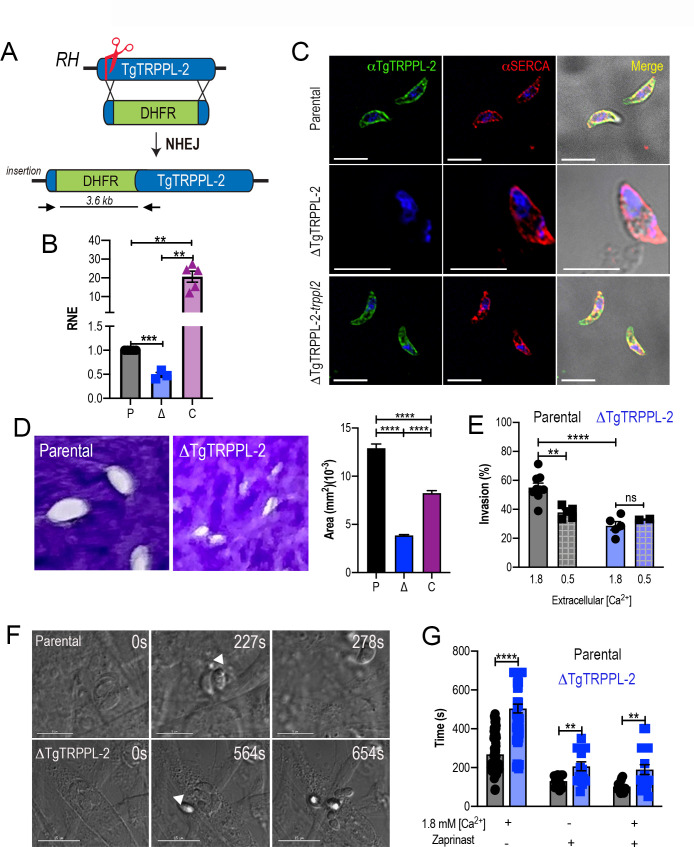
Figure 2. The role of TgTRPPL-2 in T. gondii growth.
(A) Schematic representation of the generation of ΔTgTRPPL-2 in the T. gondii RH strain. (B) qPCR of total RNA from ΔTgTRPPL-2 (Δ), ΔTgTRPPL-2-trppl2 (C), and parental strains (P) using primers upstream and downstream of the insertion site of the dihydrofolate reductase-thymidylate synthase cassette. (C) Immunofluorescence analysis of extracellular parasites showing plasma membrane labeling with αTgTRPPL-2 (1:1000) and co-localization with αSERCA (1:1000). (D) Plaque assays of parental (P), ΔTgTRPPL-2 (Δ), and ΔTgTRPPL-2-trppl2 (C) parasites. Quantification of plaque sizes from three independent biological experiments using Student’s t-test. Values are means ± SEM. ****p<0.0001. (E) Red green assays of parental, and ΔTgTRPPL-2 cells quantifying invaded and attached intracellular parasites. Assays were done at two concentrations of extracellular Ca2+: 0.5 and 1.8 mM. Values are means ± SEM. **p<0.001, ****p<0.0001. (F) Time to egress stimulated by saponin/Ca2+ at 1.8 mM extracellular Ca2+ of both parental and the ΔTgTRPPL-2 mutant. (G) Statistical analysis of average egress time stimulated by saponin or Zaprinast in the presence or absence of extracellular Ca2+. Analysis was performed from three independent biological replicates using Student’s t-test. Values are means ± SEM, **p<0.003, ****p<0.0001. Black bars represent parental strain, blue bars represent ΔTgTRPPL-2. Scale bars for C represent 5 µm.


