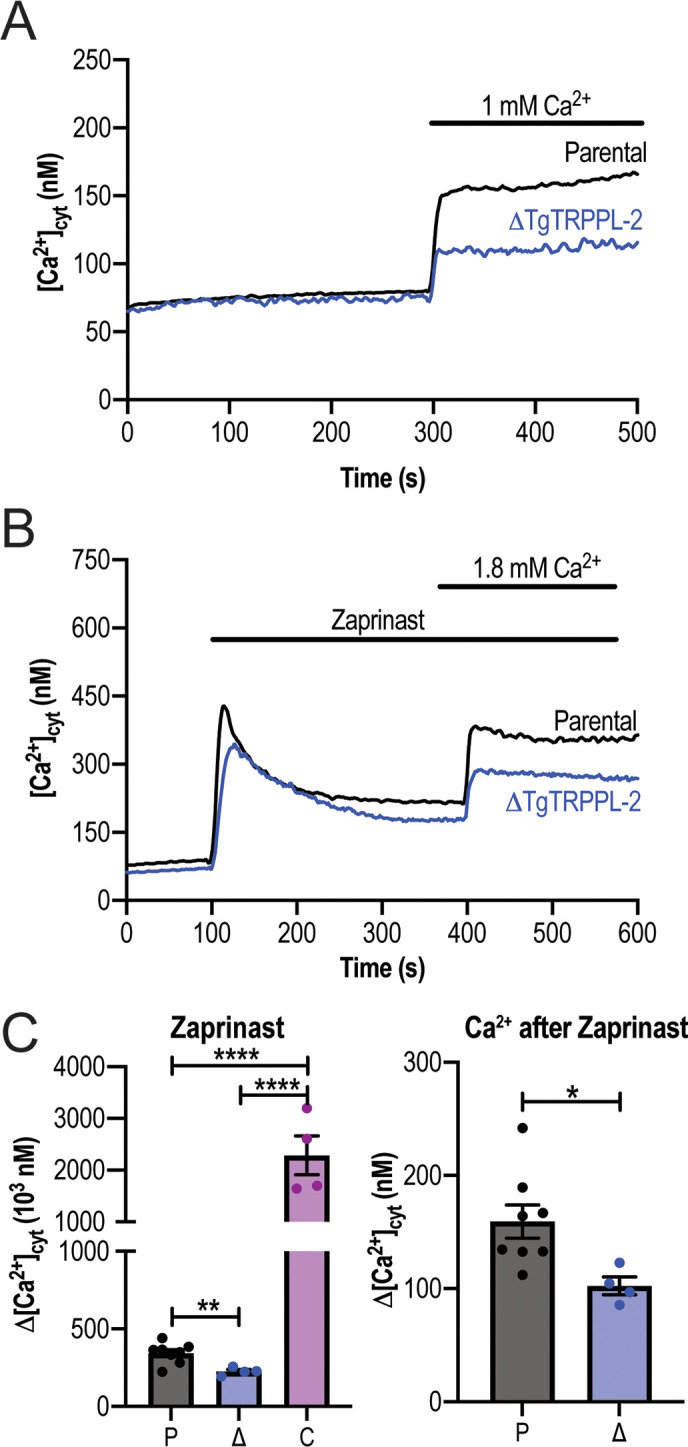
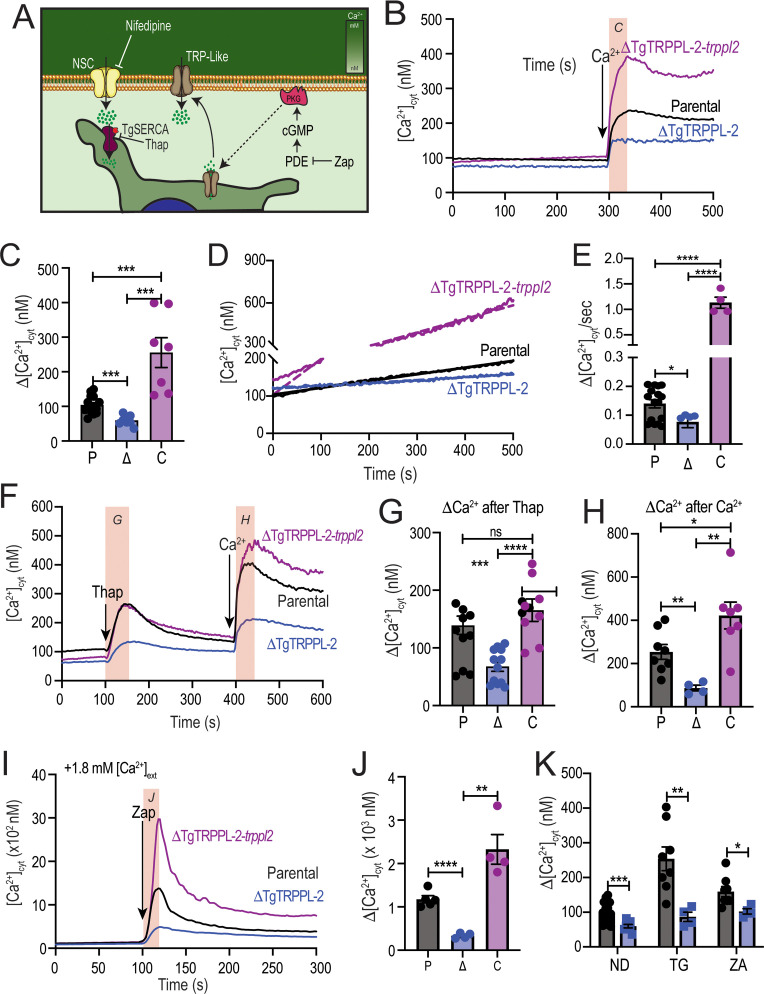
Figure 3. The role of TgTRPPL-2 in PM Ca2+ influx.
(A) Scheme showing the mechanism of Ca2+ influx and how cytosolic Ca2+ may activate the PM channel (Ca2+-activated calcium entry). NSC: nifedipine-sensitive channel; PKG: protein kinase G; PDE: phosphodiesterase; Thap: thapsigargin; Zap: Zaprinast.(B) Cytosolic Ca2+ measurements of Fura-2 loaded tachyzoites of the parental (RH), ΔTgTRPPL-2 and ΔTgTRPPL-2-trppl2 lines. The buffer contains 100 μM ethylene glycol-bis(β-aminoethyl ether)-N,N,N′,N′-tetraacetic acid (EGTA) to chelate contaminating Ca2+ and at 300 s, 1.8 mM Ca2+ were added to the suspension. The pink box indicates the area used for the quantification presented in (C). (C) Quantification and statistical analysis of the change in cytosolic Ca2+ during the first 20 s after addition of extracellular Ca2+. ***p<0.0002. (D) Constitutive Ca2+ influx into the cytosol of parasites suspended in a buffer with 1.8 mM Ca2+. (E) Quantification and statistical analysis of the slopes from (D). ****p<0.0001. (F) Cytosolic Ca2+ increase after adding Thap (1 µM) followed by Ca2+ influx after the addition of 1.8 mM extracellular Ca2+ at 400 s. The pink boxes indicate the area used for the quantification presented in (G) and (H). (G) Quantification and statistical analysis of the change in cytosolic Ca2+(Δ[Ca2+]cyt) at 50 s after the addition of Thap. (H) Quantification of the Δ[Ca2+]cyt 20 s after the addition of 1.8 mM of Ca2+. ***p<0.0008, ****p<0.0001. (I) Cytosolic Ca2+ increase stimulated by Zaprinast (100 µM) in the presence of 1.8 mM extracellular Ca2+. (J) Quantification and statistical analysis of the Δ[Ca2+]cyt during the first 15 s after adding Zaprinast (100 µM) (pink box, in I). **p<0.001, ****p<0.0001. (K) Quantification and statistical analysis of the Δ[Ca2+]cyt during the 20 s after adding Ca2+ without additions (ND) or after adding Thap or Zap. *p<0.02, **p<0.005, ***p<0.0008. Statistical analysis for all experiments was done from a minimum of three independent trials using Student’s t-test.
Figure 3—figure supplement 1. TgTRPPL-2 regulates Ca2+in T. gondii.


