. 2021 Jun 9;10:e63417. doi: 10.7554/eLife.63417

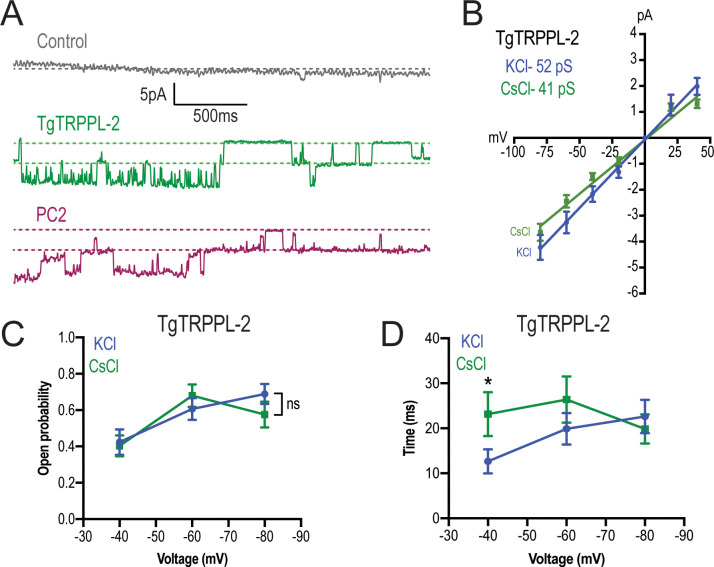
Figure 5. TgTRPPL-2 permeates Ca2+.

(A) Representative traces of currents recorded at −80 mV in the presence of 1.8 mM Ca2+ inside the pipette (Solution D, Supplementary file 4) of nuclear extracts from control, TgTRPPL-2-, or polycystin 2 (PC2)-expressing cells. Traces are a representation of 2 s. (B) Current-voltage relationship comparing single-channel current amplitude of TgTRPPL-2 cells in 1.8 mM in KCl (blue) or CsCl (green) buffer. Inset: slope conductance of TgTRPPL-2 in the different conditions analyzed. (C) Calculated open probability of TgTRPPL-2-expressing cells in the presence of 1.8 mM Ca2+ in a KCl (blue) or CsCl (green) buffer. (D) Average time of channel openings (dwell time) of TgTRPPL-2-expressing cells in the presence of 1.8 mM Ca2+ in a KCl (blue) or CsCl (green). *p<0.04. Values are means ± SEM.

Figure 5—source data 1. Channel amplitude measurements, open probability, and statistics.

Figure 5.

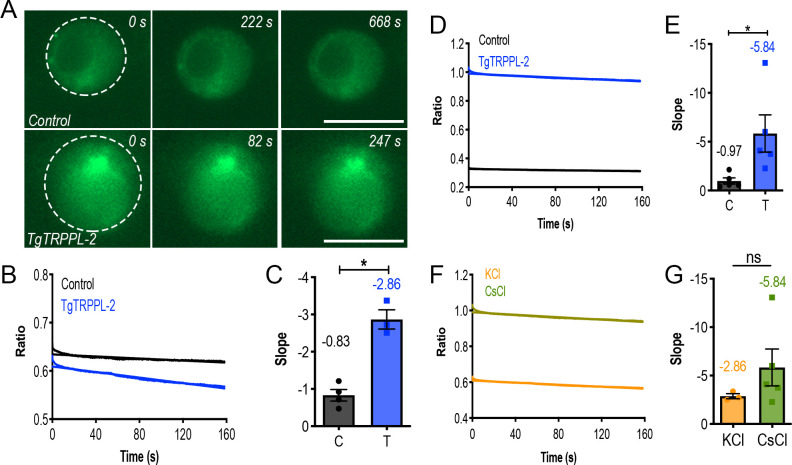
Figure 5—figure supplement 1. Measurement of endoplasmic reticulum (ER) calcium of HEK-3KO cells expressing TgTRPPL-2.

Figure 5—figure supplement 1.

(A) Fluorescence of ER calcium in ER-RFP-HEK (Control) vs. TgTRPPL-2-HEK (TgTRPPL-2) in a high calcium-potassium solution of patched nuclear membranes while the membrane is depolarized. (B) Quantification of fluorescence of patched cells while the membrane is depolarized from −80 to +40 mV in a high calcium-potassium solution. (C) Quantification of the slope of fluorescence in (B) comparing TgTRPPL-2-HEK-3KO cells versus control cells. Slope of the fluorescence was quantified based on the five technical replicates of the artificial membrane depolarization in each cell analyzed. Asterisk indicate p-value for significant difference. Values represent the mean of the slope shown in (B). *p<0.01. (D) Quantification of fluorescence of patched cells while the membrane is depolarized from −80 to +40 mV in a high calcium-cesium solution. (E) Quantification of the slope of fluorescence in (D) comparing TgTRPPL-2-HEK-3KO cells versus control cells. The slope was quantified for the five technical replicates of patched membranes. Asterisk indicates p-value for significant difference. Values represent the mean of the slope shown in (D). *p<0.03. (F) Comparison of the fluorescence of patched nuclear extract of TgTRPPL-2-HEK cells while the membrane was artificially depolarized. (G) Quantification of the slope of fluorescence of patched TgTRPPL-2-HEK-3KO nuclear extracts in different experimental conditions. Slope of the fluorescence was quantified based on the five technical replicates of the artificial membrane depolarization in each cell analyzed.
Figure 5—figure supplement 1—source data 1. Calcium fluorescence measurements and statistics.