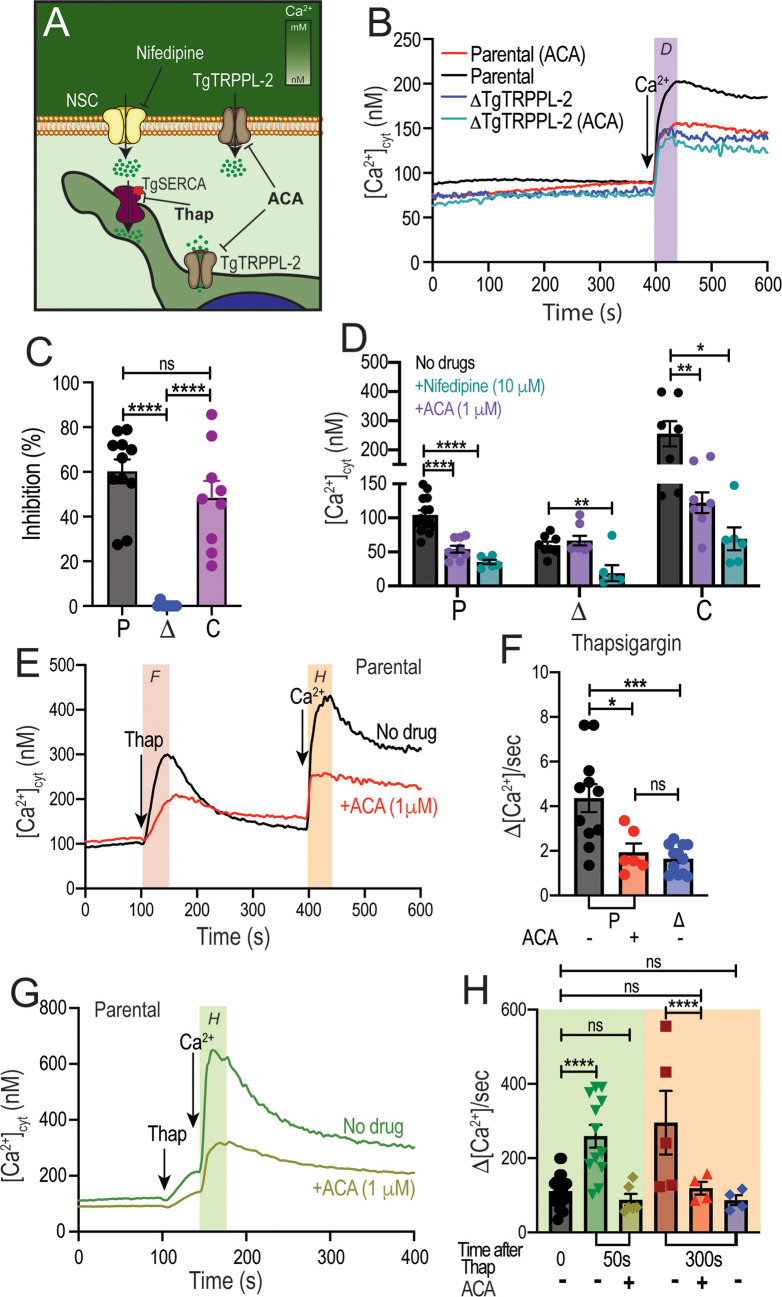
Figure 6. Regulation of TgTRPPL-2 by Ca2+and inhibition by transient receptor potential inhibitors.
(A) Scheme showing TgTRPPL-2 at the PM and endoplasmic reticulum. (B) Cytosolic Ca2+ measurements of Fura-2-loaded tachyzoites preincubated with 1 µM anthranilic acid (ACA). 1.8 mM Ca2+ was added where indicated. The purple box indicates the area used for the quantification presented in (D). (C) Percentage inhibition of Ca2+ influx in the presence of 1 µM of ACA: P: parental, Δ: ΔTgTRPPL-2 and C: ΔTgTRPPL-2-trppl2. (D) Change in cytosolic Ca2+ during the first 20 s after addition of Ca2+ in the presence of 10 µM of nifedipine or 1 µM ACA. P: parental, Δ: ΔTgTRPPL-2 and C: ΔTgTRPPL-2-trppl2. *p<0.01, **p<0.003, ****p<0.0001. (E) Cytosolic Ca2+ increase after adding Thap (1 µM) to a suspension of wild-type tachyzoites (RH). The red line shows a similar experiment, but the cells were preincubated with 1 µM ACA for 3 min. The pink and orange boxes show the areas used for the quantifications presented in (F) and (H). (F) Quantification and statistical analysis of the slope 50 s after the addition of Thap in the presence or absence of ACA in parental (P) and the ΔTgTRPPL-2 mutant (Δ). *p<0.01, ***p<0.0003. (G) Stimulation of Ca2+ influx 50 s after addition of Thap in the presence or absence of 1 µM ACA. The green box shows the area used for the quantifications presented in (H). (H) Quantification of change of cytosolic Ca2+ 20 s after the addition of 1.8 mM Ca2+ following the addition of Thap under different conditions. ****p<0.00001. The statistical analysis for all experiments was done from at least three independent trials using Student’s t-test. Values are means ± SEM.

