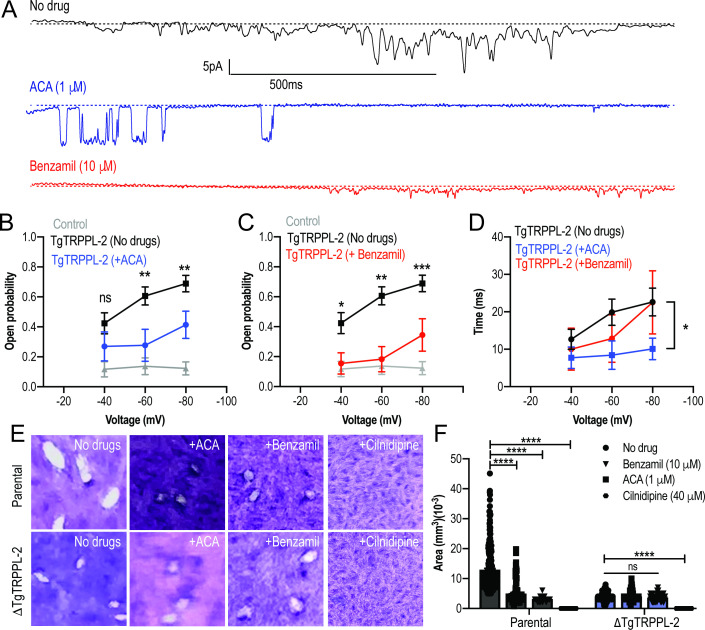
Figure 7. Transient receptor potential (TRP) inhibitors decreased the activity of TgTRPPL-2.
(A) Example of currents recorded of TgTRPPL-2-expressing cells at –80 mV without inhibitors (black trace) compared with the currents in the presence of 1 μM of anthranilic acid (ACA) (blue trace) or 10 μM of benzamil (red trace). (B) Calculated open probability of TgTRPPL-2-expressing cells (black) or in the presence of ACA (blue). **p<0.006–0.007. (C) Calculated open probability of TgTRPPL-2-expressing cells (black) or in the presence of benzamil (red). Asterisks indicate p-values for significance. *p<0.02, **p<0.002, ***p<0.0002. (D) Average time of channel opening (dwell time) of TgTRPPL-2-expressing cells in the presence of TRP inhibitors. Asterisks indicate p-values for significance, *p<0.02. (E) Plaque assay of the ΔTgTRPPL-2 mutant and the parental strain in the presence of ACA (1 μM), benzamil (10 μM), and cilnidipine (40 μM) after 7 days of growth. (F) Statistical analysis of plaque sizes done from three independent biological replicates using Student’s t-test. Values are means ± SEM, ****p<0.0001.

