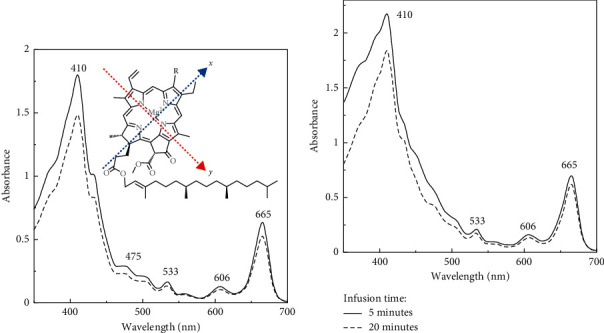
Figure 3.

The absorption spectra of the pigments extracted from tea dregs of green (a) and black teas (b) after 5 and 20 min of hot water infusion at 90°C. Figure 3(a) shows the diagonal arrows for the direction of two polarization axes in the structure of chlorophyll, x and y, contributing to the absorption band at 665 nm (Qy band), 533 (Qx band), and 410 nm (overlapped Soret band).
