
Figure 6.
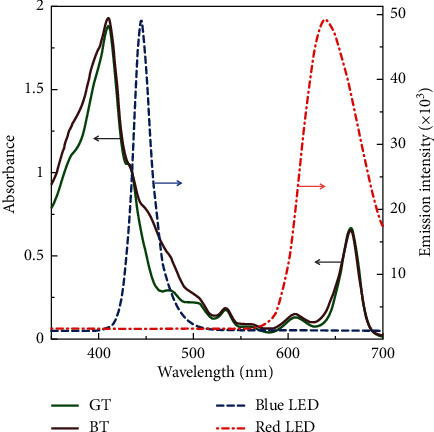
Absorption spectra of pigments extracted from the dregs of green (GT) and black teas (BT), being overlapped with the blue and red LED emission spectra. The arrows point to the axis for the marked curves.
Official websites use .gov
A
.gov website belongs to an official
government organization in the United States.
Secure .gov websites use HTTPS
A lock (
) or https:// means you've safely
connected to the .gov website. Share sensitive
information only on official, secure websites.
Absorption spectra of pigments extracted from the dregs of green (GT) and black teas (BT), being overlapped with the blue and red LED emission spectra. The arrows point to the axis for the marked curves.